Guest, Sign inJoin

Post to Cherry Valley

We’ll email a one-tap link to publish your post. No password, and nothing is public until you click it.
Already a member? Sign in
Illinois›Winnebago County

Cherry ValleyIL

Is Cherry Valley a good place to live?

Cherry Valley grades D overall, 741st of 767 graded towns in Illinois, mostly because of schools and safety. Its schools rank behind 95% of the state's. It reports more crime per resident than 94% of U.S. towns, including 11 violent crimes reported to the FBI in 2025. What it does well: it has 17 miles of trail and 37% conserved land. Cherry Valley’s property crime rate is 35 per 1,000 residents, above both the Illinois town median (7.9) and the median of U.S. towns (9.9). Cherry Valley's civic life (library use, community groups, volunteering) trails 87% of U.S. towns. Deer Run Forest Preserve, at 519 acres with 5.5 miles of trail, is the biggest park or preserve.

What makes Cherry Valley stand out

Where Cherry Valley beats most towns.

Get outside

17 miles of trails in Cherry Valley

37.4% of the town is conserved land, across 11 parks and preserves.

Map of trails and conserved land in Cherry ValleyConservedTrails
1
Deer Run Forest Preserve5.5 mi of trails · 519 acres
Directions
2
Oak Ridge Forest Preserve3.4 mi of trails · 297 acres
Directions
3
Blackhawk Springs Forest Preserve2.3 mi of trails · 400 acres
Directions
Trails © OpenStreetMap contributors · USGS PAD-US

How Cherry Valley grades

Each subject compared with towns across the country (schools within Illinois), ordered by how far Cherry Valley is from typical.

How grading works

Character Graded, but not part of the overall grade.
Described, not graded Taste, not quality: snow or an older crowd is neither good nor bad.

How TownRatings grades towns →

NORTH ELEVATION - Hale House, State Route 5
NORTH ELEVATION - Hale House, State Route 5, 1933
Cherry Valley’s story

177 years in pictures

Census counts: 349 in 1900, 2,905 in 2020. The archive holds 10 old photos and papers going back to 1933 and 4 maps from 1918 on.

  • 1849Cherry Valley is settled
Explore the history →
Getting set up

Moving to Cherry Valley: who provides what

Who provides power, water and the rest in Cherry Valley, and how to reach them.

The full setup list →
PowerCommonwealth Edison17.7¢/kWh · EIA 2025HIFLD · EIA
WaterCherry Valley water systemNo health-based violations in 5 years · EPAEPA
Internet6 providers99% of addresses get 100/20 MbpsFCC
Trash & dumpNot on file yetWe don’t have Cherry Valley’s trash rules yet
SchoolsRockford School District 205Which school depends on your addressNCES
Register to voteOnlineIn Illinois you can register online until 16 days before Election Day, in person up to and including Election Day, or by mail (postmarked 28 days before).vote.gov
Who runs elections hereWinnebago County ClerkWinnebago County; contacts on the Handbook page.FVAP, Oct 2024
ZIP codes61016, 61108, 61109, 6111261016 63% · 61108 25% · 61109 7% · 61112 5%Census 2020

EPA SDWIS (Oct 9, 2026) · HIFLD + EIA-861 2025 · Census 2020 ZCTAs · NCES 2024–25 · registration: vote.gov, updated Sep 12, 2025.
The data

Ordered by what stands out in Cherry Valley.

Cherry Valley carries less natural-hazard risk than nearly all of Illinois (mostly inland flooding), draws workers from Rockford and beyond and keeps more of its land conserved than most of Illinois.

OutdoorsA+

Trail density in Cherry Valley is higher than in the typical Illinois or U.S. town

Its 2,059 conserved acres are a larger share of the town than in any other Illinois town. Its A+ for the outdoors ranks #18 of 768 in Illinois.

Cherry Valley’s trail density is 2.0 miles per square mile. 17 miles of trail in 11 parks and preserves.

#22for trails in IL
37.4%
conserved · 2,059 of 5,500 acres
17 mi
of trails · 2 per sq mi
Biggest places to walkTrailsAcres
1. Deer Run Forest Preserve5.5 mi519
2. Oak Ridge Forest Preserve3.4 mi297
3. Blackhawk Springs Forest Preserve2.3 mi400

Trails & parks © OpenStreetMap contributors · Conserved land: USGS PAD-US

SafetyD

Cherry Valley’s grade for safety is a D

Property crime runs at 35 per 1,000 residents, about twice the Illinois rate, most of it theft. Reported crimes fell from 161 to 112 over the last three FBI years, a drop beyond ordinary year-to-year swings.

The violent crime rate in Cherry Valley is 3.8 per 1,000 residents. Cherry Valley reports more crime per resident than most U.S. towns we grade: about 94% report less.

6%of U.S. towns report more crimeDSafety Grade

Violent crime per 1,000 residents

Cherry Valley3.8
Illinois2.6
U.S.3.3

Property crime per 1,000 residents

Cherry Valley35
Illinois15.6
U.S.15.5
6th
percentile among U.S. towns we grade
4th
percentile among IL towns
11
violent crimes reported in 2025
101
property crimes reported in 2025

FBI crime data, 2025 · crimes reported to police

Work & commuteJobs & income grade B

About two in five of Cherry Valley’s working residents commute to Rockford

2,568 jobs are based in Cherry Valley, 2.1 for every working resident, so most of the people who work here commute in.

Most working residents leave Cherry Valley for work: only 3% work in town. Since 2013, Cherry Valley has lost 178 jobs, to 2,568 in 2023. The top destinations are Rockford (41%), Belvidere (7%) and Loves Park (3%).

3%work in town
Cherry ValleyIllinois townsU.S. towns
Working residents who work in town2.5%8.4%8%
Average trip to work24 minutes26 minutes25 minutes
Median household income$75,000$83,000$80,000

Where working residents work

In Cherry Valley3%
Rockford41%
Belvidere7%
Loves Park3%
Chicago3%
8 mi
median commute distance
2,568
jobs based in Cherry Valley
A job hub
jobs vs. working residents
B−
Walkability grade: more walkable than 46% of U.S. towns

Census LEHD 2023 · ACS

Natural hazardsHazard risk grade B

Cherry Valley faces a very low natural-hazard risk, led by inland flooding

FEMA rates its natural-hazard risk lower than 94% of Illinois towns, with expected losses of about $450 per resident a year; that rating is what its B for hazard risk is built on.

Since 1999, 4 flood insurance claims have been paid out in Cherry Valley.

17risk score of 100
FEMA risk score
17Very low riskLowerHigher
Inland floodingTornadoesCold waves
4
paid flood claims since 1999
7
federal disasters paid out here

FEMA flood insurance claims · FEMA National Risk Index · OpenFEMA

HealthB+

Cherry Valley ranks healthier than 66% of the country’s towns

Cherry Valley beats the Illinois average on 10 of 32 CDC measures and trails it on 7. 15% of Cherry Valley adults report frequent mental distress.

66%healthier than U.S. townsB+Health Grade
Cherry ValleyIllinois townsU.S. towns
Frequent mental distress (CDC PLACES)15%17%17%
High blood pressure (CDC PLACES)39%35%35%
Yearly checkup (CDC PLACES)82%78%79%
Binge drink (CDC PLACES)16%18%16%
32 measures vs. Illinois
10 better15 too close to call7 worse
What stands outCherry ValleyIL
Fewer adults facing housing insecurity8.4%13.2%
Fewer adults facing food insecurity10.3%15.9%
More adults who have had cancer11.4%7.6%
Saint Anthony Medical Center
2.7 mi away · emergency room
2 of 3
care shortages: primary care, mental health
51st
percentile among IL towns

CDC PLACES 2025 · modeled estimates for adults · CMS · HRSA

Climate

Cherry Valley has four seasons and pleasant summers

Cherry Valley has cold, snowy winters and pleasant summers. July afternoons reach 84°, January nights drop to 14° and about 37 inches of snow falls in a winter.

37″snow a winter

Typical low → high °F

Winter17–32°
Spring38–59°
Summer60–82°
Fall41–62°
Oct 17
typical first frost
Apr 24
typical last frost
+1.2°
vs. the 20th-century average

NOAA U.S. Climate Normals, 1991–2020

Who lives here

More young adults than Illinois overall

Adults 18 to 34 are 27% of residents (23% statewide); adults 35 to 64 are 34% of residents (39% statewide). 30% of adults 25 and older have a bachelor’s degree or more, vs 38% across Illinois. 20% of residents are 65 or older in Cherry Valley.

45.1median age · IL 39
Cherry ValleyIllinois townsU.S. towns
Under 1818%22%22%
Median age45.1 years40.7 years40.5 years
Aged 65 or older20%19%18%
Cherry ValleyIllinoisUnited States

Ages · share of residents

Education · adults 25 and older

No diploma7%
High school33%
Some college24%
Associate’s7%
Bachelor’s21%
Graduate9%

Women and men · all residents

52% women, 48% men

That’s an even split within the survey’s margin of ±4.9 points. Across Illinois, 50.6% of residents are women.

Ages and education in Cherry Valley
Cherry ValleyILU.S.
Under 1012.3%11.5%11.6%
10 to 176%10.4%10.3%
18 to 2411%9.1%9.1%
25 to 3416%13.6%13.7%
35 to 444.3%13.3%13.2%
45 to 5415.9%12.4%12.2%
55 to 6414.2%12.8%12.7%
65 to 7411.3%10%10.2%
75 and older9.1%7%7%
No diploma6.9%9.5%10.4%
High school33.1%25.1%26%
Some college23.5%19.2%19.1%
Associate’s6.5%8.3%8.8%
Bachelor’s21%22.6%21.6%
Graduate9%15.3%14.1%

U.S. Census Bureau · ACS 2020-2024 5-year estimates · in a town of 2,900, single groups can be off by several points

HousingCost of living grade C

A home in Cherry Valley sells for about $280K at the median

60.4% of renter households pay 30% or more of their income for housing, against 47.9% across Illinois.

$280Kmedian sale price
Market temperature
Seller’s marketA strong seller's marketBuyer’sSeller’s
8
days on market
101.2%
sale-to-list price
6
homes sold in May

Zillow Home Value Index · Redfin Data Center

Nearby attractions

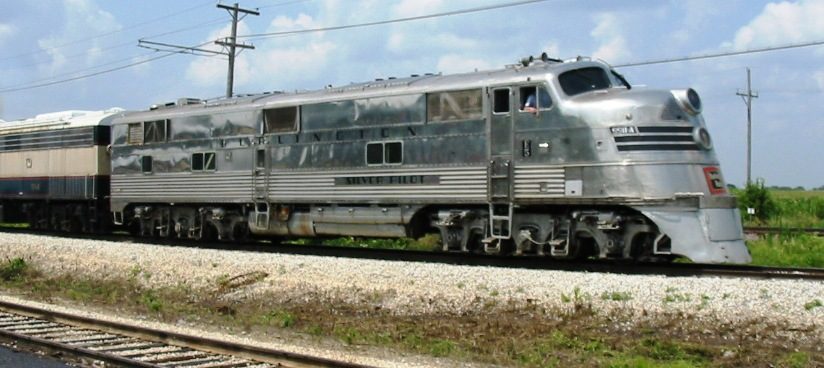
Illinois Railway Museum and 15 more within 40 miles

Museums, parks, gardens and other places to visit around Cherry Valley. Close and well known come first.

All 39 attractions →
Sources: National Park Service · ski areas © OpenSkiMap / OpenStreetMap contributors · Wikidata · Wikipedia readership · photos via Wikimedia Commons
Photo credits

Illinois Railway Museum: The original uploader was Slambo at English Wikipedia., CC BY-SA 2.0 · BMO Center: SimLibrarian, CC0 · Anderson Japanese Gardens: M. Readey, CC BY-SA 3.0 · Egyptian Theatre, DeKalb: Andy McMurray, CC BY 2.5 · Ronald Reagan Boyhood Home National Historic Site: Teemu008 from Palatine, Illinois, CC BY-SA 2.0 · Santa's Village Amusement & Water Park: Martin Lewison from The Hague, Zuid-Holland, The Netherlands, CC BY-SA 2.0

Keep exploring

Everything we know about Cherry Valley

20pages on Cherry Valley
After high school

Colleges nearby

3 within 15 miles of the center of Cherry Valley

A job hub

Every workday, about 2,537 people come to Cherry Valley for work

Where Cherry Valley’s working residents go each day. Line width shows the share.

41% → Rockford Rockford 41% 7% → Belvidere Belvidere 7% 3% → Loves Park Loves Park 3% 3% → Chicago Chicago 3% 2% → Machesney Park Machesney Park 2% 2% → Beloit Beloit 2% Cherry Valley · 3% stay
2,568jobs based in Cherry Valley
3%of working residents work in town
8 mimedian commute distance

Census LEHD 2023

About Cherry Valley

Village in Illinois, US

Official town website ↗

Cherry Valley is a village of 8.72 square miles (22.6 km2) that lies primarily in Winnebago County, Illinois. Approximately ten percent of the village is within Boone County. The village is within the Rockford, Illinois Metropolitan Statistical Area, and borders the southeast side of Rockford. It is also within the Kishwaukee River valley. The population was 2,905 at the 2020 census, down from 3,162 as of the 2010 census.

From Wikipedia, licensed CC BY-SA 4.0 · facts via Wikidata (CC0)

Area
8.6 sq mi
Elevation
728 ft
ZIP code
61016

Cherry Valley’s neighbors

4 towns share a border with Cherry Valley.

Explore the map →
How the neighbors grade
TownIL rankOverallCostSafetySchoolsHealth
Cherry Valley#741DCDDB+
Rockford · Rockford Township#767D−C+D−DD
Belvidere#658C−C+B+C−C−
Cherry Valley Township#720DC+—DC+

Cherry Valley Township reports no FBI crime data of its own. Rockford Township and Rockford are one community, graded once. Compare Cherry Valley with a neighbor →

Questions about Cherry Valley

Short answers, built from the data on this page.

Is Cherry Valley, IL a good place to live?

Cherry Valley grades D overall, better than 7% of U.S. towns and #741 of 767 in Illinois. It grades B+ for health, D for safety and D for schools. Schools is its weak spot, with a D.

Is Cherry Valley, IL expensive?

Yes. The typical home is worth about $233,000, 21% below the Illinois typical home. Cost of living, which also weighs rents, property taxes and how many households pay 30% or more of their income for housing, grades C.