
Sainte-PétronilleQuebec
It belongs to the Québec metropolitan area. Home to 1,015 people, this town lies in Quebec.
Is Sainte-Pétronille a good place to live?
Sainte-Pétronille’s best grade is for health (A+). It also does well on safety (A+). Where it falls short is walkability (D−). The typical owner put their home at $400,000 in 2021: 3.7 years of the median household’s income. Hazard risk is weaker too (C).
Figures: home values and income: Statistics Canada, Census 2021. With fewer than 2,500 residents, Sainte-Pétronille gets subject grades but no overall one among Canadian towns.
Rents here are the metro area's average, shared by every town and neighbourhood in it. Safety is the Sûreté du Québec unit's figure for the whole MRC. No School Grade: this province doesn't publish comparable results school by school. Health is graded on the health region's survey figures and life expectancy, with the distance to hospital giving the town its own spread.
How Sainte-Pétronille grades
Each subject compares Sainte-Pétronille with Canadian towns of 2,500 or more, ordered by how far it is from the middle. Towns in other countries are graded separately.
With fewer than 2,500 residents, Sainte-Pétronille gets subject grades but no overall one among Canadian towns.
How TownRatings grades Canadian towns →
What makes Sainte-Pétronille stand out
The 3 things Sainte-Pétronille does most differently from other towns.
The data
Data highlights are ordered by what stands out in Sainte-Pétronille.
Health in Sainte-Pétronille beats almost every Canadian town
The survey counts 9.6% of adults as smokers, lower than both Quebec’s towns (12%) and Canadian towns (12%). Across the region, 62% of adults say their health is very good or excellent; Quebec as a whole manages 57%. The region’s 2022/2024 life expectancy is 82.9, with women at 84.7 and men at 81.1. For Sainte-Pétronille itself the measure is access, and it lags: 5.8 km to the nearest hospital, where 3.7 km is typical. For health survey and life expectancy, the only official count covers all of the Région de la Capitale-Nationale, Sainte-Pétronille included.
Very good or excellent health · adults, age-standardised
| Health | Sainte-Pétronille | Quebec | Canada |
|---|---|---|---|
| Very good or excellent health | 62% | 56% | 52% |
| Chronic conditions (average share) | 14% | 15% | 17% |
| Smokers | 9.6% | 12% | 12% |
| Life expectancy at birth | 82.9 | 82.5 | 81.5 |
Statistics Canada, Canadian Community Health Survey 2023/2024 and life expectancy 2022/2024; Open Database of Healthcare Facilities
Crime runs lighter where Sainte-Pétronille is policed than in Quebec’s towns or Canadian towns, at an index of 27
Property crime in its police area ran at 7.8 per 1,000 residents a year, below both Quebec’s towns (16.6) and Canadian towns (31.2). For every 1,000 residents of its police area, 6.6 violent incidents are reported each year.
Year by year · Crime Severity Index for each year
| 2023–2025 | Sainte-Pétronille | Quebec | Canada |
|---|---|---|---|
| Crime Severity Index | 27 | 56 | 67 |
| Property crime per 1,000 | 7.8 | 16.6 | 31.2 |
| Violent Crime Severity Index | 45 | 88 | 86 |
| Violent crime | 6.6 | 12.4 | 12 |
Statistics Canada, Uniform Crime Reporting Survey, 2023–2025 average · Crime Severity Index, Violent Crime Severity Index, violent crime and property crime per 1,000: Île-d'Orléans MRC
Households in Sainte-Pétronille have higher incomes than those in 93% of Canadian towns
95% of commuters drove to work at the census. Workers spend 27 min getting to work, on average.
How working residents got to work · census 2021
| Census 2021 | Sainte-Pétronille | Quebec | Canada |
|---|---|---|---|
| Car or van | 95% | 90% | 89% |
| Average trip | 27 min | 27 min | 26 min |
Statistics Canada, Census 2021 (labour and commuting) · The 2021 census was taken in May 2021, during COVID-19 restrictions: more people than usual worked from home or were off work.
Hazards in Sainte-Pétronille: wildfire low, radon over the guideline in 8.8% of tested homes
Measured across the Capitale-Nationale health region: radon tests
Seismic risk runs high: $0.11 of expected damage per $1,000 of buildings a year, the typical town $0.030. Flood mapping: none on the national inventory for Sainte-Pétronille.
Radon tests above the guideline · share of tested homes, 200 Bq/m³
| Hazards | Sainte-Pétronille | Quebec | Canada |
|---|---|---|---|
| Earthquake loss per $1,000 of buildings a year | $0.11 | $0.14 | $0.030 |
| Radon tests above the guideline | 8.8% | 8.2% | 6.6% |
NRCan seismic risk model and burned areas, Health Canada radon survey, the Flood Hazard Map Inventory
Rent takes less of local pay in Sainte-Pétronille than in Quebec’s towns or Canadian towns: 14% of household income
88% of households own their home, higher than both Quebec’s towns (70%) and Canadian towns (74%). Shelter took 30% or more of income for 17% of households, above Quebec’s towns (13%) but below Canadian towns (18%). Behind rent as a share of income and monthly rent for a two-bedroom sits data gathered across the Québec metro area, with Sainte-Pétronille one part of it.
What homes were worth · The median owner’s estimate at the 2021 census
| Census 2021 | Sainte-Pétronille | Quebec | Canada |
|---|---|---|---|
| Households owning their home | 88% | 70% | 74% |
| Rent as a share of income | 14% | 18% | 20% |
| Households spending 30%+ on shelter | 17% | 13% | 18% |
Statistics Canada, Census 2021; CMHC Rental Market Survey via Statistics Canada · The 2021 census asked owners what their home was worth; those values, and 2020 incomes, are what this compares.
Summers stay cool in Sainte-Pétronille: July afternoons reach 24.9°C, below Quebec’s towns and Canadian towns
The most precipitation falls in July: 129 mm in a normal year. Some 299 cm of snow falls in a typical year, above both Quebec’s towns (217 cm) and Canadian towns (141 cm). The coldest nights come in January, when Sainte-Pétronille averages a low of −16.6°C. A normal December brings 77 cm of snow, the most of any month.
Average high by season · ECCC normals, 1991–2020
| Normals, 1991–2020 | Sainte-Pétronille | Quebec | Canada |
|---|---|---|---|
| Snowfall a year | 299 cm | 217 cm | 141 cm |
| Precipitation a year | 1,216 mm | 1,041 mm | 883 mm |
| July afternoon high | 24.9°C | 26.5°C | 25.5°C |
| Days with frost a year | 179 | 161 | 159 |
Environment and Climate Change Canada, Canadian Climate Normals 1991–2020 (Lauzon)
An older town: 31% of people in Sainte-Pétronille are 65 or over, more than in Quebec’s towns and across Canadian towns
Both official languages: 48% of residents, above both Quebec’s towns (44%) and Canadian towns (7.5%). 13% of residents are children under 15.
Ages · Share of residents in each age group, Census 2021
Schooling · Highest qualification, residents 15 and over
Women and men · all residents
50.7% of Sainte-Pétronille’s residents are women
Of the 2021 count, 535 were women and 520 men (women across Canada: 50.9%).
| Sainte-Pétronille | Quebec | Canada | |
|---|---|---|---|
| Under 15 | 13% | 17% | 16% |
| 15 to 64 | 56% | 62% | 64% |
| 65+ | 31% | 20% | 19% |
| No certificate, diploma or degree | 8.4% | 19% | 16% |
| Postsecondary qualification | 70% | 59% | 56% |
Statistics Canada, Census 2021; Quebec and Canada: medians of towns of 2,500+
Few places match Sainte-Pétronille for protected land nearby: more than 8 in 10 Canadian towns
I.O. Saint-Jean Ouest Water Fowl Gathering Area (990 ha) is the biggest, 9.0 km from town. CPCAD lists 41 protected areas within 10 km. National parks are all over 100 km off. A provincial park, Jacques-Cartier National Park (Québec), lies 32 km away.
Protected land · of the land within 10 km
| Outdoors | Sainte-Pétronille | Quebec | Canada |
|---|---|---|---|
| Protected land within 10 km | 8.7% | 4.9% | 2.3% |
| Public protected areas within 10 km | 18 | 10 | 4 |
Canadian Protected and Conserved Areas Database (CPCAD), OpenStreetMap routes and beaches
A normal November in Sainte-Pétronille runs from −4°C to 4°C
Into December, the normals move to −3°C and −12°C. A typical November adds 24 cm of snow. Expect about 84 mm of rain and snow over November. Hour-by-hour figures come from ECCC’s Québec forecast, on the Weather page.
Normal highs, the months ahead · ECCC normals, 1991–2020
| Season | High | Low | Rain and snow |
|---|---|---|---|
| Winter | −5°C | −15°C | 261 mm |
| Spring | 8°C | −2°C | 270 mm |
| Summer | 24°C | 12°C | 366 mm |
| Autumn | 11°C | 2°C | 319 mm |
ECCC normals, 1991–2020 (Lauzon); the forecast is on the Weather page
Myriam Thériault heads the council of Sainte-Pétronille as mayor
The Liberal Party of Canada has 44 of the 78 MPs elected in Quebec.
Wikidata, MAMH, MMAH, Statistics Canada
The nearest public library to Sainte-Pétronille is Bibliothèque Fernand-Dumont, 3.9 km away
The next is Bibliothèque Marguerite-Poire (Lévis), 5.2 km away.
Provincial library statistics, OpenStreetMap, the CRA and Statistics Canada
Sainte-Pétronille has 2 independent schools among its 5
Within 3 km of Sainte-Pétronille are 3 elementary schools, 1 secondary school and 1 school for every grade. Young children have 3.3 km to the nearest elementary school, above Quebec’s towns (0.5 km) and Canadian towns (0.5 km) alike.
| School | Level | Students | System |
|---|---|---|---|
| École du Ruisseau, Sainte-Marie (Ruisseau, du)Nearest elementary school, 2.2 kmElementary | Elementary | – | French public |
| École Sainte-Famille, Pavillon Marguerite-Bourgeois IndependentNearest secondary school, 2.4 kmSecondary | Secondary | – | Independent |
Schools by system · Schools within 3 km
| Schools within 3 km | Sainte-Pétronille | Quebec | Canada |
|---|---|---|---|
| School boards | 2 | 2 | 3 |
| Nearest elementary school | 3.3 km | 0.5 km | 0.5 km |
| Nearest secondary school | 3.8 km | 1.2 km | 1.2 km |
Provincial school lists and results, 2025-26 · Schools grade in Quebec: none (the ministry publishes its success rates by school service centre, not school by school).
Everything we know about Sainte-Pétronille
Montmorency Falls and 11 more in and around Sainte-Pétronille
The best-known places to visit in and around Sainte-Pétronille come first; the full list is on the Attractions page.
 WaterfallMontmorency Falls3.1 km outside town, to the northwest
 MuseumLévis Forts3.9 km outside town, to the south
 Garden · SépaqParc de la Chute-Montmorency2.8 km outside town, to the northwest
 Art galleryMaison Vézina3 km outside town, to the northwestMuseumMuseumEspace Félix Leclerc2.1 km outside town, to the northArt galleryArt galleryEspace-temps3.3 km outside town, to the southwest
Photos: each place’s Wikidata image, from Wikimedia Commons under the licence below (our copy, resized).
Photo credits (4)
- Montmorency Falls: Jean-Christophe BENOIST, CC BY 4.0, Wikimedia Commons
- Lévis Forts: Bernard Gagnon, CC BY-SA 3.0, Wikimedia Commons
- Parc de la Chute-Montmorency: Gilbertus, CC BY 3.0, Wikimedia Commons
- Maison Vézina: Sylvainbrousseau, CC BY-SA 3.0, Wikimedia Commons
Famous people from around Sainte-Pétronille
One notable person was born in Sainte-Pétronille; with them, the best known born in the towns around it.

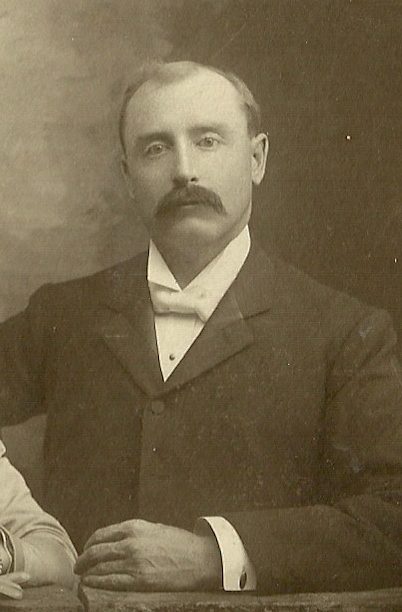
Photo credits
Roger Blais: Cinémathèque québécoise, 2007.0071.PH.02, Public domain · Romuald Montézuma Gendron: TheLeaf94, CC BY-SA 3.0
About Sainte-Pétronille
Town in Quebec
Every figure TownRatings gives for Sainte-Pétronille covers the municipality as Statistics Canada maps it, one census subdivision in Quebec.
Statistics Canada: population estimates 2025 (17-10-0155), Census of Population 2021, 2021 census boundaries.
- Population
- 1,015 (people, 2025 estimate)
- Province or territory
- Quebec
- Census division
- L'Île-d'Orléans
- Metro area
- Québec
- Census subdivision
- 2420030
Sainte-Pétronille’s neighbours
The nearest places of 1,000 or more. Statistics Canada
| Town | People | km | Overall | Cost | Safety | Health |
|---|---|---|---|---|---|---|
| Sainte-Pétronille | 1,015 | — | — | B+ | A+ | A+ |
| Chutes-Montmorency | 16,273 | 4.7 | B+ | C− | B− | A+ |
| Vieux-Bourg | 14,774 | 5.4 | B+ | C− | B− | A+ |
| Saint-Pierre-de-l'Île-d'Orléans | 1,704 | 6.4 | — | C | A+ | A+ |
| Boischatel | 9,250 | 6.5 | A+ | A | A− | A+ |
| Saint-Laurent-de-l'Île-d'Orléans | 1,659 | 7.3 | — | C+ | A+ | A+ |
| Vieux-Moulin | 15,935 | 7.4 | B− | D | B− | A+ |
People: Statistics Canada, Census 2021. Distances: centre to centre.
Questions about Sainte-Pétronille
Do people in Sainte-Pétronille speak French?
Almost everyone does. 48% are bilingual, where the median of Canadian towns is 8%, and 51.2% speak French and no English.
What kind of homes are in Sainte-Pétronille?
Single-detached houses make up 96% of the homes here, where Canadian towns sit at 64%; 0% are in high-rise apartments. 26% of households are one person, and the average is 2.3.
Who are the people of Sainte-Pétronille?
At the 2021 census, 9% were immigrants and 0% belonged to a visible minority (Canadian towns’ median: 15%). 1% identify as First Nations, Métis or Inuit.
Has Sainte-Pétronille grown?
It grew from 1,033 people in 2016 to 1,055 in 2021, up 2.1%; the median of Canadian towns grew 4.1%. StatCan’s 2025 estimate is 1,015.
Sources: Statistics Canada, Census of Population 2021 · population estimates 2025 (17-10-0155) and 2021 census boundaries · Uniform Crime Reporting Survey 2023–25 (35-10-0026, 35-10-0183 to 35-10-0190) · CMHC rents as published by Statistics Canada (34-10-0133) · grades by TownRatings. Under the Statistics Canada Open Licence.
Adapted from Statistics Canada (Census of Population 2021, population estimates 2025, 2021 census boundaries) under the Statistics Canada Open Licence; this does not constitute an endorsement by Statistics Canada. Neighbourhood names in some cities © OpenStreetMap contributors (ODbL).