
Saint-PaulQuebec
7,208 people call this town in Quebec home. Statistics Canada counts it in the Joliette metro area.
Is Saint-Paul a good place to live?
Good on most counts; one lags. Residents are healthier than most (A−). It also does well on jobs & income (A−). Few people walk, cycle or take the bus to work (C). Overall, that makes an A−, better than just over three quarters of Canadian towns. The ranking puts it #215 of 499 in Quebec. Its remaining grades are unremarkable: B− for safety and C+ for hazard risk.
Safety is the Sûreté du Québec unit's figure for the whole MRC. No School Grade: this province doesn't publish comparable results school by school. Health is graded on the health region's survey figures and life expectancy, with the distance to hospital giving the town its own spread.
What makes Saint-Paul stand out
The 3 things Saint-Paul does most differently from other towns.
How Saint-Paul grades
Each subject compares Saint-Paul with Canadian towns of 2,500 or more, ordered by how far it is from the middle. Towns in other countries are graded separately.
How TownRatings grades Canadian towns →
The data
Data highlights are ordered by what stands out in Saint-Paul.
Around Saint-Paul, 56% of adults call their health very good or excellent
Health survey and life expectancy for the Région de Lanaudière
Arthritis, diabetes and high blood pressure affect 15% of the region’s adults on average, near Quebec’s towns (15%) and lower than Canadian towns (17%). The region’s 2022/2024 life expectancy is 82.0, with women at 83.7 and men at 80.3. For Saint-Paul itself the measure is access: 4.2 km to the nearest hospital, much like the typical 3.7 km.
Very good or excellent health · adults, age-standardised
| Health | Saint-Paul | Quebec | Canada |
|---|---|---|---|
| Chronic conditions (average share) | 15% | 15% | 17% |
| Smokers | 14% | 12% | 12% |
| Very good or excellent health | 56% | 56% | 52% |
| Life expectancy at birth | 82.0 | 82.5 | 81.5 |
Statistics Canada, Canadian Community Health Survey 2023/2024 and life expectancy 2022/2024; Open Database of Healthcare Facilities
Saint-Paul has 0.4 jobs for every resident in work, so most commute out
Commutes averaged 26 min, near both Quebec’s towns (27 min) and Canadian towns (26 min).
How working residents got to work · census 2021
| Census 2021 | Saint-Paul | Quebec | Canada |
|---|---|---|---|
| Average trip | 26 min | 27 min | 26 min |
Statistics Canada, Census 2021 (labour and commuting) · Counted in May 2021, under pandemic rules: fewer commutes and more people between jobs than in a normal year.
Renting in Saint-Paul costs 16% of household income, less than in both Quebec’s towns and Canadian towns
Measured across the Joliette metro area: rent as a share of income and monthly rent for a two-bedroom
Households that own their home make up 82%. 10% of households spent 30% or more of their income on shelter, below Quebec’s towns (13%) and Canadian towns (18%) alike.
What homes were worth · The median owner’s estimate at the 2021 census
| Census 2021 | Saint-Paul | Quebec | Canada |
|---|---|---|---|
| Households spending 30%+ on shelter | 10% | 13% | 18% |
| Rent as a share of income | 16% | 18% | 20% |
| Households owning their home | 82% | 70% | 74% |
Statistics Canada, Census 2021; CMHC Rental Market Survey via Statistics Canada · Values come from owners at the 2021 census and incomes from 2020, so they predate the later rise in rates.
Children make up 22% of Saint-Paul, above Quebec’s towns and Canadian towns
15% of residents are 65 or over. Both official languages: 29% of residents, below Quebec’s towns (44%) but above Canadian towns (7.5%).
Ages · Share of residents in each age group, Census 2021
Schooling · Highest qualification, residents 15 and over
Women and men · all residents
Women make up 49.6% of Saint-Paul
Women numbered 3,260 and men 3,310 in 2021, next to a 50.9% share of women for Canada.
| Saint-Paul | Quebec | Canada | |
|---|---|---|---|
| Under 15 | 22% | 17% | 16% |
| 15 to 64 | 64% | 62% | 64% |
| 65+ | 15% | 20% | 19% |
| No certificate, diploma or degree | 17% | 19% | 16% |
| Postsecondary qualification | 58% | 59% | 56% |
Statistics Canada, Census 2021; Quebec and Canada: medians of towns of 2,500+
Precipitation in Saint-Paul tops that of 82% of Canadian towns: 1,109 mm a year
January nights in Saint-Paul drop to −16.0°C on average. Some 202 cm of snow falls in a typical year, lower than Quebec’s towns (217 cm) yet higher than Canadian towns (141 cm). For the wettest month, look to August: 114 mm on average. December is the snowiest month, with 49 cm on average.
Average high by season · ECCC normals, 1991–2020
| Normals, 1991–2020 | Saint-Paul | Quebec | Canada |
|---|---|---|---|
| Precipitation a year | 1,109 mm | 1,041 mm | 883 mm |
| Snowfall a year | 202 cm | 217 cm | 141 cm |
| July afternoon high | 26.6°C | 26.5°C | 25.5°C |
| January night low | −16.0°C | −14.7°C | −13.5°C |
Environment and Climate Change Canada, Canadian Climate Normals 1991–2020 (L'Assomption)
Saint-Paul earns a C+ for hazard risk
Averaged over the years, quake damage costs $0.17 per $1,000 of buildings, higher than both Quebec’s towns ($0.14) and Canadian towns ($0.030). In Health Canada’s survey, just 3.9% of homes tested in the area exceeded 200 Bq/m³ (6.6% typical). Saint-Paul doesn’t get its own radon tests figures; the ones here come from the Lanaudiere health region.
Radon tests above the guideline · share of tested homes, 200 Bq/m³
| Hazards | Saint-Paul | Quebec | Canada |
|---|---|---|---|
| Earthquake loss per $1,000 of buildings a year | $0.17 | $0.14 | $0.030 |
| Radon tests above the guideline | 3.9% | 8.2% | 6.6% |
NRCan seismic risk model and burned areas, Health Canada radon survey, the Flood Hazard Map Inventory
Saint-Paul earns a B− for safety
The violent index for its police area came to 108, above both Quebec’s towns (88) and Canadian towns (86). Violent crime in the area its police cover: 14.7 per 1,000 people a year. Thefts, break-ins and damage add up to 19.2 per 1,000 residents a year where it is policed. For Crime Severity Index, Violent Crime Severity Index, violent crime and property crime per 1,000, the only official count covers all of Joliette MRC, Saint-Paul included.
Year by year · Crime Severity Index for each year
| 2023–2025 | Saint-Paul | Quebec | Canada |
|---|---|---|---|
| Violent Crime Severity Index | 108 | 88 | 86 |
| Property crime per 1,000 | 19.2 | 16.6 | 31.2 |
| Violent crime | 14.7 | 12.4 | 12 |
Statistics Canada, Uniform Crime Reporting Survey, 2023–2025 average
Expect November days around 5°C in Saint-Paul, nights around −3°C
For today and the week ahead, the Weather page carries ECCC’s Joliette forecast. Snow is normal by November, about 12 cm over the month. Then December: −2°C by day, −10°C at night. Precipitation in November averages 90 mm.
Normal highs, the months ahead · ECCC normals, 1991–2020
| Season | High | Low | Rain and snow |
|---|---|---|---|
| Winter | −4°C | −14°C | 227 mm |
| Spring | 11°C | 0°C | 265 mm |
| Summer | 25°C | 14°C | 322 mm |
| Autumn | 13°C | 3°C | 295 mm |
ECCC normals, 1991–2020 (L'Assomption); the forecast is on the Weather page
Saint-Paul’s council spends less per resident than 96% of Québec’s local municipalities
For the National Assembly of Québec, Saint-Paul belongs to Joliette, held by Véronique Venne (Parti Québécois) as MNA (Member of the National Assembly, Québec’s legislature).
Wikidata, MAMH, MMAH, Statistics Canada
Saint-Paul public library draws 1.2 visits per person served, behind 92% of Quebec’s town libraries
From 2 branches, Saint-Paul public library serves 7,128 people.
Provincial library statistics, OpenStreetMap, the CRA and Statistics Canada
The outdoors around Saint-Paul
La Mauricie National Park is the closest national park, 79 km from town. fleuve Saint-Laurent, Lanoraie, Lavaltrie Water Fowl Gathering Area (1,525 ha) is the biggest, 8.7 km from town. Parks and reserves take up 2.4% of the ground within 10 km, lower than Quebec’s towns (4.9%) and near Canadian towns (2.3%).
Protected land · of the land within 10 km
| Outdoors | Saint-Paul | Quebec | Canada |
|---|---|---|---|
| Protected land within 10 km | 2.4% | 4.9% | 2.3% |
| Public protected areas within 10 km | 5 | 10 | 4 |
Canadian Protected and Conserved Areas Database (CPCAD), OpenStreetMap routes and beaches
19 schools serve Saint-Paul, 12 elementary schools, 5 secondary schools and 2 schools for every grade
Measured from the centre, the closest high school lies 2.4 km off, above both Quebec’s towns (1.2 km) and Canadian towns (1.2 km).
| School | Level | Students | System |
|---|---|---|---|
| École primaire de la Passerelle (Vert-Demain)In Saint-PaulElementary | Elementary | – | French public |
| École secondaire de Joliette EnglishNearest secondary school, 0.1 kmSecondary | Secondary | – | English public |
Schools by system · Schools within 3 km
| Schools within 3 km | Saint-Paul | Quebec | Canada |
|---|---|---|---|
| School boards | 2 | 2 | 3 |
| Nearest secondary school | 2.4 km | 1.2 km | 1.2 km |
Provincial school lists and results, 2025-26 · In Quebec, no schools grade. The ministry publishes its success rates by school service centre, not school by school.
One place in Saint-Paul, at the top of the registers
9.4% of its homes were built before 1961, below Quebec’s towns (21%) and Canadian towns (18%) alike.
Historic places by designation · inside the town
Among them
- Église Saint-Paul 1803
| Heritage | Saint-Paul | Quebec | Canada |
|---|---|---|---|
| Homes built before 1961 | 9.4% | 21% | 18% |
Canadian Register of Historic Places, Directory of Federal Heritage Designations, Québec’s Répertoire du patrimoine culturel, Wikidata; Census 2021 homes by period
St Charles Borromeo Cathedral and 2 more in and around Saint-Paul
What there is to see in Saint-Paul and within a short drive, starting with the places most people have heard of.
 CathedralSt Charles Borromeo Cathedral2.1 km outside town, to the north
 MuseumMusée d'art de Joliette1.9 km outside town, to the north
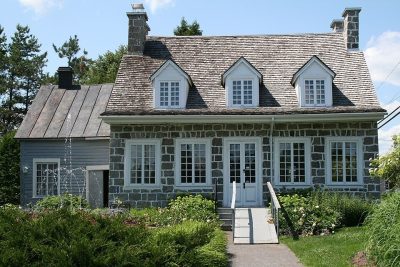 GardenMaison Antoine-Lacombe5 km outside town, to the northwest
Photos: each place’s Wikidata image, from Wikimedia Commons under the licence below (our copy, resized).
Photo credits (3)
- St Charles Borromeo Cathedral: Fralambert, CC BY-SA 4.0, Wikimedia Commons
- Musée d'art de Joliette: Jaboileaumiss, CC BY-SA 4.0, Wikimedia Commons
- Maison Antoine-Lacombe: Dreamdan, CC BY-SA 3.0, Wikimedia Commons
Everything we know about Saint-Paul
Famous people from Saint-Paul
4 notable people were born in Saint-Paul.

Photo credits
Joseph Pierre Octave Guilbault: William James Topley, Public domain
Saint-Paul’s neighbours
The nearest places of 1,000 or more. Statistics Canada
| Town | People | km | Overall | Cost | Safety | Health |
|---|---|---|---|---|---|---|
| Saint-Paul | 7,208 | — | A− | B+ | B− | A− |
| Joliette | 22,408 | 3 | C | D | B− | A− |
| Crabtree | 4,237 | 4 | B− | C+ | B− | A− |
| Saint-Charles-Borromée | 16,904 | 6.5 | C+ | D | B− | A− |
| Notre-Dame-des-Prairies | 9,622 | 6.8 | B | C+ | B− | A− |
| Saint-Thomas | 3,477 | 7.3 | B+ | C+ | B− | A− |
| Sainte-Marie-Salomé | 1,296 | 8.8 | — | B− | B | B+ |
People: Statistics Canada, Census 2021. Distances: centre to centre.
Questions about Saint-Paul
Is Saint-Paul growing?
Between the 2016 and 2021 censuses it went from 5,891 to 6,566 residents (up 11.5%; Canadian towns’ median: 4.1%), and Statistics Canada now estimates 7,208.
Do people in Saint-Paul speak French?
It is a French-speaking town: 70.4% know French alone, and 29% can talk in English too, against 8% for the median of Canadian towns.
Who are the people of Saint-Paul?
At the 2021 census, 4% were immigrants and 4% belonged to a visible minority (Canadian towns’ median: 15%). 2% identify as First Nations, Métis or Inuit.
What kind of homes are in Saint-Paul?
A household averages 2.4 people; 25% are one person living alone.
About Saint-Paul
Town in Quebec
Statistics Canada treats Saint-Paul as a single census subdivision in Quebec, and TownRatings keeps to that line.
Statistics Canada: population estimates 2025 (17-10-0155), Census of Population 2021, 2021 census boundaries.
- Population
- 7,208 (people, 2025 estimate)
- Province or territory
- Quebec
- Census division
- Joliette
- Metro area
- Joliette
- Census subdivision
- 2461005
Sources: Statistics Canada, Census of Population 2021 · population estimates 2025 (17-10-0155) and 2021 census boundaries · Uniform Crime Reporting Survey 2023–25 (35-10-0026, 35-10-0183 to 35-10-0190) · CMHC rents as published by Statistics Canada (34-10-0133) · grades by TownRatings. Under the Statistics Canada Open Licence.
Adapted from Statistics Canada (Census of Population 2021, population estimates 2025, 2021 census boundaries) under the Statistics Canada Open Licence; this does not constitute an endorsement by Statistics Canada. Neighbourhood names in some cities © OpenStreetMap contributors (ODbL).