
MontcalmQuébec
13,572 residents make their home in this neighbourhood in Québec. It is one of 35 neighbourhoods of Québec.
Is Montcalm a good place to live?
A good place to live, if you can afford it. Montcalm’s overall grade, B+, puts it better than two thirds of Canadian towns. Its place in the ranking is #266 of 499 in Quebec. Residents are healthier than most (A+). The trade-off is cost of living (D). Hazard risk is higher than most (C−).
Rents here are the metro area's average, shared by every town and neighbourhood in it. Safety less sure: this is the whole city's figure, because the city doesn't publish open neighbourhood crime rates. No School Grade: this province doesn't publish comparable results school by school. Health is graded on the health region's survey figures and life expectancy, with the distance to hospital giving the town its own spread.
How Montcalm grades
Each subject compares Montcalm with Canadian towns of 2,500 or more, ordered by how far it is from the middle. Towns in other countries are graded separately.
How TownRatings grades Canadian towns →
What makes Montcalm stand out
The 3 things Montcalm does most differently from other towns.
The data
Data highlights are ordered by what stands out in Montcalm.
For health, Montcalm is ahead of almost every Canadian town
Area-wide: health survey and life expectancy, counted over the Région de la Capitale-Nationale
Adults who call their own health very good or excellent: 62%, above Quebec’s towns (56%) and Canadian towns (52%) alike. Statistics Canada puts the region’s life expectancy at 82.9, women 84.7 and men 81.1 (2022/2024). Smoking is rarer than in the province: 9.6% of adults, against 12% for Quebec. For Montcalm itself the measure is access, and it scores well: 1.0 km to the nearest hospital, where 3.7 km is typical.
Very good or excellent health · adults, age-standardised
| Health | Montcalm | Quebec | Canada |
|---|---|---|---|
| Very good or excellent health | 62% | 56% | 52% |
| Chronic conditions (average share) | 14% | 15% | 17% |
| Smokers | 9.6% | 12% | 12% |
| Life expectancy at birth | 82.9 | 82.5 | 81.5 |
Statistics Canada, Canadian Community Health Survey 2023/2024 and life expectancy 2022/2024; Open Database of Healthcare Facilities
Measured against local pay, Montcalm costs more to live in than 88% of Canadian towns
Measured across the Québec metro area: rent as a share of income and monthly rent for a two-bedroom
Just over a fifth of households spent 30% or more of their income on shelter, above both Quebec’s towns (13%) and Canadian towns (18%). The median home value was $400,000, above Quebec’s towns ($300,000) and close to Canadian towns ($406,000).
What homes were worth · The median owner’s estimate at the 2021 census
| Census 2021 | Montcalm | Quebec | Canada |
|---|---|---|---|
| Households spending 30%+ on shelter | 22% | 13% | 18% |
| Rent as a share of income | 22% | 18% | 20% |
Statistics Canada, Census 2021; CMHC Rental Market Survey via Statistics Canada · Values come from owners at the 2021 census and incomes from 2020, so they predate the later rise in rates.
Wildfire low, radon 8.8%: how Montcalm stands on hazards
Earthquake risk for the city of Québec
Seismic risk runs high: $0.14 of expected damage per $1,000 of buildings a year, the typical town $0.030. Flood mapping: none on the national inventory for Montcalm. Montcalm doesn’t get its own radon tests figures; the ones here come from the Capitale-Nationale health region.
Radon tests above the guideline · share of tested homes, 200 Bq/m³
| Hazards | Montcalm | Quebec | Canada |
|---|---|---|---|
| Earthquake loss per $1,000 of buildings a year | $0.14 | $0.14 | $0.030 |
| Radon tests above the guideline | 8.8% | 8.2% | 6.6% |
NRCan seismic risk model and burned areas, Health Canada radon survey, the Flood Hazard Map Inventory
Trips to work from Montcalm are shorter than from Quebec’s towns or Canadian towns: 21 min on average
How working residents got to work · census 2021
| Census 2021 | Montcalm | Quebec | Canada |
|---|---|---|---|
| Average trip | 21 min | 27 min | 26 min |
Statistics Canada, Census 2021 (labour and commuting) · Counted in May 2021, under pandemic rules: fewer commutes and more people between jobs than in a normal year.
Montcalm is wetter than 90% of Canadian towns: 1,216 mm of rain and snow a year
For the wettest month, look to July: 129 mm on average. Some 299 cm of snow falls in a typical year, above both Quebec’s towns (217 cm) and Canadian towns (141 cm). Expect July highs of around 25.1°C in Montcalm. Snow peaks in December: 77 cm in a normal year.
Average high by season · ECCC normals, 1991–2020
| Normals, 1991–2020 | Montcalm | Quebec | Canada |
|---|---|---|---|
| Snowfall a year | 299 cm | 217 cm | 141 cm |
| Precipitation a year | 1,216 mm | 1,041 mm | 883 mm |
| July afternoon high | 25.1°C | 26.5°C | 25.5°C |
| January night low | −15.6°C | −14.7°C | −13.5°C |
Environment and Climate Change Canada, Canadian Climate Normals 1991–2020 (Ste-Foy (U. Laval))
Montcalm is more bilingual than Quebec’s towns or Canadian towns: 62% speak both languages
One measure of family life: nearly one in ten residents are under 15. Just over a third of residents are 65 or over, higher than both Quebec’s towns (20%) and Canadian towns (19%).
Ages · Share of residents in each age group, Census 2021
Schooling · Highest qualification, residents 15 and over
Women and men · all residents
54.5% of Montcalm’s residents are women
Women numbered 7,400 and men 6,185 in 2021, next to a 50.9% share of women for Canada.
| Montcalm | Quebec | Canada | |
|---|---|---|---|
| Under 15 | 8.5% | 17% | 16% |
| 15 to 64 | 56% | 62% | 64% |
| 65+ | 35% | 20% | 19% |
| No certificate, diploma or degree | 5.3% | 19% | 16% |
| Postsecondary qualification | 82% | 59% | 56% |
Statistics Canada, Census 2021; Quebec and Canada: medians of towns of 2,500+
In Montcalm, November normally means 4°C afternoons and −3°C nights
A normal December brings highs of −3°C, lows of −10°C. November usually brings some 24 cm of snow. In November, the normal is 84 mm of rain and snow. The forecast on the Weather page is ECCC’s for Québec.
Normal highs, the months ahead · ECCC normals, 1991–2020
| Season | High | Low | Rain and snow |
|---|---|---|---|
| Winter | −5°C | −13°C | 261 mm |
| Spring | 9°C | −1°C | 270 mm |
| Summer | 24°C | 13°C | 366 mm |
| Autumn | 12°C | 3°C | 319 mm |
ECCC normals, 1991–2020 (Ste-Foy (U. Laval)); the forecast is on the Weather page
At 8.5 visits per person served, Québec public library is busier than 90% of Quebec’s town libraries
Québec public library serves the whole of Québec, so the library figures on this page are the city’s: 594,443 people, Montcalm among them.
Provincial library statistics, OpenStreetMap, the CRA and Statistics Canada
Jacques-Cartier National Park (Québec), 35 km away, is the closest provincial park to Montcalm
17 protected areas lie within 10 km. Within 100 km there is no national park. The protected share within 10 km is 4.7%, where a typical Canadian town has 2.3%. 7.2 km out lies the largest, Île d'Orléans (ouest du pont) Water Fowl Gathering Area, at 325 ha.
Protected land · of the land within 10 km
| Outdoors | Montcalm | Quebec | Canada |
|---|---|---|---|
| Protected land within 10 km | 4.7% | 4.9% | 2.3% |
| Public protected areas within 10 km | 10 | 10 | 4 |
Canadian Protected and Conserved Areas Database (CPCAD), OpenStreetMap routes and beaches
Montcalm gets a B− for safety
Its police area recorded 15.1 violent incidents per 1,000 residents a year, above both Quebec’s towns (12.4) and Canadian towns (12). Property crime in the area its police cover: 22.1 per 1,000 people a year. Nobody publishes Crime Severity Index, Violent Crime Severity Index, violent crime and property crime per 1,000 for Montcalm alone, so this card uses the figure for the Québec service area.
Year by year · Crime Severity Index for each year
| 2023–2025 | Montcalm | Quebec | Canada |
|---|---|---|---|
| Property crime per 1,000 | 22.1 | 16.6 | 31.2 |
| Violent crime | 15.1 | 12.4 | 12 |
Statistics Canada, Uniform Crime Reporting Survey, 2023–2025 average
Montcalm’s schools come under 4 different boards
Independent schools number 13 of 44, above the 9% in Quebec. In or within 3 km of Montcalm: 25 elementary schools, 14 secondary schools and 5 schools for every grade.
| School | Level | Students | System |
|---|---|---|---|
| École Anne-HébertIn MontcalmElementary | Elementary | – | French public |
| École Joseph-François-PerraultIn MontcalmSecondary | Secondary | – | French public |
| École secondaire Québec High School EnglishTeaches in EnglishSecondary | Secondary | – | English public |
Schools by system · Schools within 3 km
| Schools within 3 km | Montcalm | Quebec | Canada |
|---|---|---|---|
| School boards | 4 | 2 | 3 |
Provincial school lists and results, 2025-26 · Towns in Quebec aren’t in the schools rankings: the ministry publishes its success rates by school service centre, not school by school.
An older town: 46% of Montcalm’s homes predate 1961
The earliest construction date, 1849, belongs to Henry-Stuart House. Inside the town there are 4 historic places, all of them top designations.
Historic places by designation · inside the town
Among them
| Heritage | Montcalm | Quebec | Canada |
|---|---|---|---|
| Homes built before 1961 | 46% | 21% | 18% |
Canadian Register of Historic Places, Directory of Federal Heritage Designations, Québec’s Répertoire du patrimoine culturel, Wikidata; Census 2021 homes by period
Everything we know about Montcalm
Musée national des beaux-arts du Québec and 69 more in and around Montcalm
Sights in Montcalm and close by, ordered by how widely each is known.
 MuseumMusée national des beaux-arts du Québecin town · 324K visitors a year
 BattlefieldPlains of Abrahamin town
 MuseumPavillon Pierre-Lassondein town
 MuseumPavillon Charles-Baillairgéin town
 MuseumMusée de la civilisation2.1 km outside town, to the northeast · 497K visitors a year
 CastleQuébec Citadel1.3 km outside town, to the northeast
Photos: each place’s Wikidata image, from Wikimedia Commons under the licence below (our copy, resized).
Photo credits (6)
- Musée national des beaux-arts du Québec: colros, CC BY-SA 2.0, Wikimedia Commons
- Plains of Abraham: NickHam, CC BY-SA 3.0, Wikimedia Commons
- Pavillon Pierre-Lassonde: Cephas, CC BY-SA 4.0, Wikimedia Commons
- Pavillon Charles-Baillairgé: Jeangagnon, CC BY-SA 3.0, Wikimedia Commons
- Musée de la civilisation: Claude Gagnon, CC BY-SA 3.0, Wikimedia Commons
- Québec Citadel: chensiyuan, CC BY-SA 4.0, Wikimedia Commons
Famous people from around Montcalm
No notable person born in Montcalm is on our list; these were born in the towns around it.


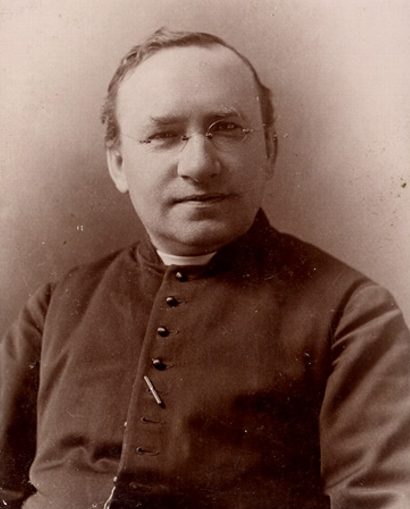
Photo credits
Antoine Valois-Fortier: Mohammad Hassansadeh / Tasnimnews, CC BY 4.0 · Irma LeVasseur: Bibliothèque et Archives nationales du Québec P655,S2,SS6,D8, Public domain · Oscar Drouin: Unknown author, Public domain · Victor-Alphonse Huard: J.E. Livernois, Public domain
About Montcalm
Neighbourhood in Québec
Montcalm is one of Québec’s neighbourhoods, which TownRatings draws from census dissemination areas and names from the city’s own map or OpenStreetMap.
Statistics Canada: population estimates 2025 (17-10-0155), Census of Population 2021, 2021 census boundaries.
- Population
- 13,572 (people, 2021 estimate)
- Province or territory
- Quebec
- City
- Québec
- Census subdivision
- 2423027
Montcalm’s neighbours
The nearest places of 1,000 or more. Statistics Canada
| Town | People | km | Overall | Cost | Safety | Health |
|---|---|---|---|---|---|---|
| Montcalm | 13,572 | — | B+ | D | B− | A+ |
| Saint-Sauveur | 16,104 | 1 | B− | D | B− | A+ |
| Saint-Jean-Baptiste | 8,882 | 1.1 | B− | D− | B− | A+ |
| Saint-Roch | 8,381 | 1.5 | B− | D | B− | A+ |
| Saint-Sacrement | 10,650 | 1.6 | B | D | B− | A+ |
| Vieux-Québec—Cap-Blanc—Colline parlementaire | 5,764 | 2 | B− | D | B− | A+ |
| Vanier | 13,494 | 2.7 | B− | D | B− | A+ |
People: Statistics Canada, Census 2021. Distances: centre to centre.
Questions about Montcalm
Do people in Montcalm speak French?
French is the common language here. 62% of residents also speak English (the median of Canadian towns: 8%), and 36.5% speak French but not English.
Is Montcalm a young town or an old one?
Its median age is 53.6, where Canadian towns sit at 45.2. Under-15s are 9% of residents; over-65s, 35%.
Sources: Statistics Canada, Census of Population 2021 · population estimates 2025 (17-10-0155) and 2021 census boundaries · Uniform Crime Reporting Survey 2023–25 (35-10-0026, 35-10-0183 to 35-10-0190) · CMHC rents as published by Statistics Canada (34-10-0133) · grades by TownRatings. Under the Statistics Canada Open Licence.
Adapted from Statistics Canada (Census of Population 2021, population estimates 2025, 2021 census boundaries) under the Statistics Canada Open Licence; this does not constitute an endorsement by Statistics Canada. Neighbourhood names in some cities © OpenStreetMap contributors (ODbL).