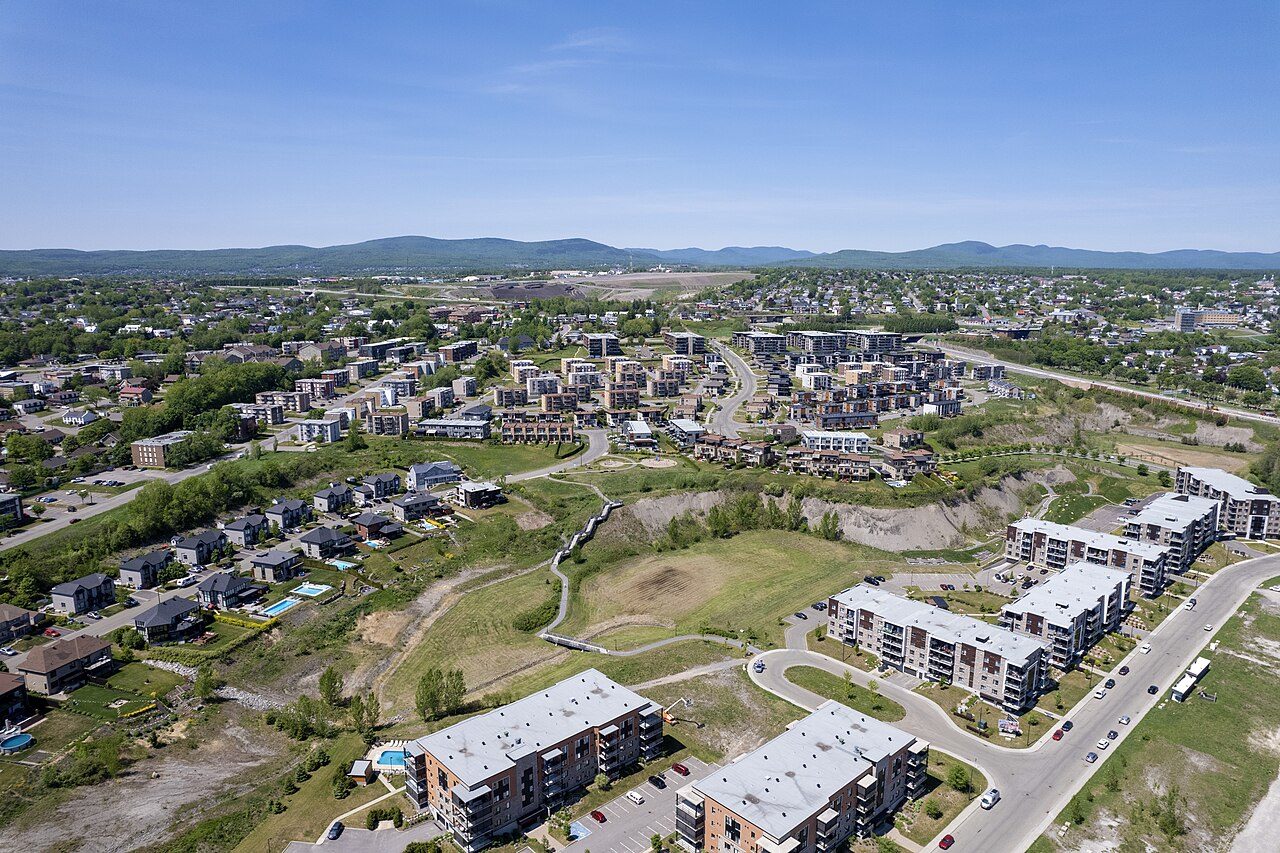
 Photo: Gabriel Picard · CC BY-SA 4.0
Half the owned homes in Chutes-Montmorency are valued above $280,000
Some 3,900 owner households gave their home’s value to the 2021 census. There is no public record of sale prices in Quebec, which leaves the census value as the guide for Chutes-Montmorency. Single-family homes are on the 2025 roll at a median $365,000; the roll values them as of July 1, 2023. For property-roll values and building permits, the only official count covers all of the city of Québec, Chutes-Montmorency included.
What Chutes-Montmorency’s homes are worth, two ways
Each source sits beside its own median for Quebec’s towns; none compares across provinces, which value homes in their own ways. Owners gave those values at the May 2021 census; they are estimates, and older than today’s prices.
median, owners’ estimate
- Average
- $295K
- Owners
- 3,900
- Quebec’s towns
- $300K
- The typical Canadian town
- $406K
single-family, market at July 1, 2023
- Quebec’s towns
- $353K
Census 2021 (Statistics Canada); Canadian Housing Statistics Program, tables 46-10-0099 and 46-10-0093; Québec rôle d’évaluation foncière 2026 (MAMH).
17% of Québec’s dwellings are in plexes, where Quebec’s towns have 16%
Dwellings on the roll of Québec: 37% in buildings of six units or more, 34% in single-family houses, 17% in plexes and 11% in condos. There are 272 chalets on it too, with a median of $144,000.
Median roll value by kind, 2025 the tick is the median of Quebec’s towns
Dwellings by kind of building
Rôle d’évaluation foncière 2025 (MAMH): a kind’s median needs 10 units or more; plexes are valued per building; each municipality’s roll has its own market date. The ticks are the median of Québec’s municipalities with their own roll.
More apartments than most: 46% of the homes in Chutes-Montmorency (Quebec’s towns: 22%)
Chutes-Montmorency had 7,785 occupied homes at the 2021 census. The older half dates from before 2001. Summed from small census areas, a neighbourhood’s parts may add up to a little less than its total.
Homes by period of construction the tick is the median of Quebec’s towns
Homes by kind
| Chutes-Montmorency | Quebec | Canada | |
|---|---|---|---|
| Condominiums | 17% | 8% | 8% |
| Needing major repairs | 4% | 6% | 6% |
| Too small for the household | 1% | 2% | 3% |
| Households in core housing need | 5% | 3% | 7% |
Census 2021 (Statistics Canada): occupied private dwellings; core housing need as Statistics Canada defines it. Ticks and columns are medians of the towns and neighbourhoods of 2,500 or more.
Permits in Québec ran at 16.4 homes a year per 1,000, near the 15.1 of Quebec’s towns
Some 4,243 homes a year: 25,458 in all were permitted in Québec from 2018 to 2023. Apartments and other multi-unit buildings dominate: only 4% were single-unit, against 39% for Quebec’s towns.
Most in 2021: 5,398 new homes
New homes a year per 1,000 homes
Up 25%: 11,737 new homes in the year to August 2026
Monthly permits for the Québec metro area
Statistics Canada, tables 46-10-0087 (building permits by census subdivision, 2018–2023: dwelling units created, new construction and conversions) and 34-10-0292 (monthly, metro areas). Per 1,000: units a year over 2019–2023 against occupied homes in 2021.
Chutes-Montmorency against Quebec’s towns: about level with the $300,000 median
510 of Quebec’s towns (2,500 people or more), by median value at the 2021 census, dearest first.
Census 2021, owners’ estimates; towns and neighbourhoods of 2,500 or more, no city as a whole, no reserve.
Lower values near Chutes-Montmorency: Vieux-Moulin
The places around Chutes-Montmorency at the 2021 census: median and average value, and how many own.
| Town | Median home value | Average | Owners | km |
|---|---|---|---|---|
| Chutes-Montmorency | $280K | $295K | 50% | |
| Vieux-Bourg | $276K | $288K | 52% | 2.3 |
| Saint-Michel | $280K | $300K | 83% | 3.1 |
| Boischatel | $352K | $395K | 90% | 3.1 |
| Sainte-Thérèse-de-Lisieux | $278K | $298K | 87% | 4.4 |
| Sainte-Pétronille | $400K | $452K | 88% | 4.7 |
| Vieux-Moulin | $240K | $265K | 38% | 4.7 |
Census 2021 values; km.
Questions about property prices in Chutes-Montmorency
How many households in Chutes-Montmorency are in core housing need?
About as many as elsewhere: 5% of households in Chutes-Montmorency, where Quebec’s towns sit at 3%.
Is Chutes-Montmorency expensive for Quebec?
In the middle: Quebec’s towns come to $300,000, and so, near enough, does Chutes-Montmorency.
Sources: Statistics Canada, Census of Population 2021 · Statistics Canada, building permits (tables 46-10-0087 and 34-10-0292) · Ministère des Affaires municipales et de l’Habitation, rôle d’évaluation foncière 2026. Under the Statistics Canada Open Licence.
Adapted from Statistics Canada (Census of Population 2021, population estimates 2025, 2021 census boundaries) under the Statistics Canada Open Licence; this does not constitute an endorsement by Statistics Canada. Neighbourhood names in some cities © OpenStreetMap contributors (ODbL).