First pick
Le parc de déléage
Park or garden · 240 m outside town
1.4 ha0.4 km of path
1.1 km eastfrom the centre
Directionsto a point inside
Each edition grades its towns against each other only.
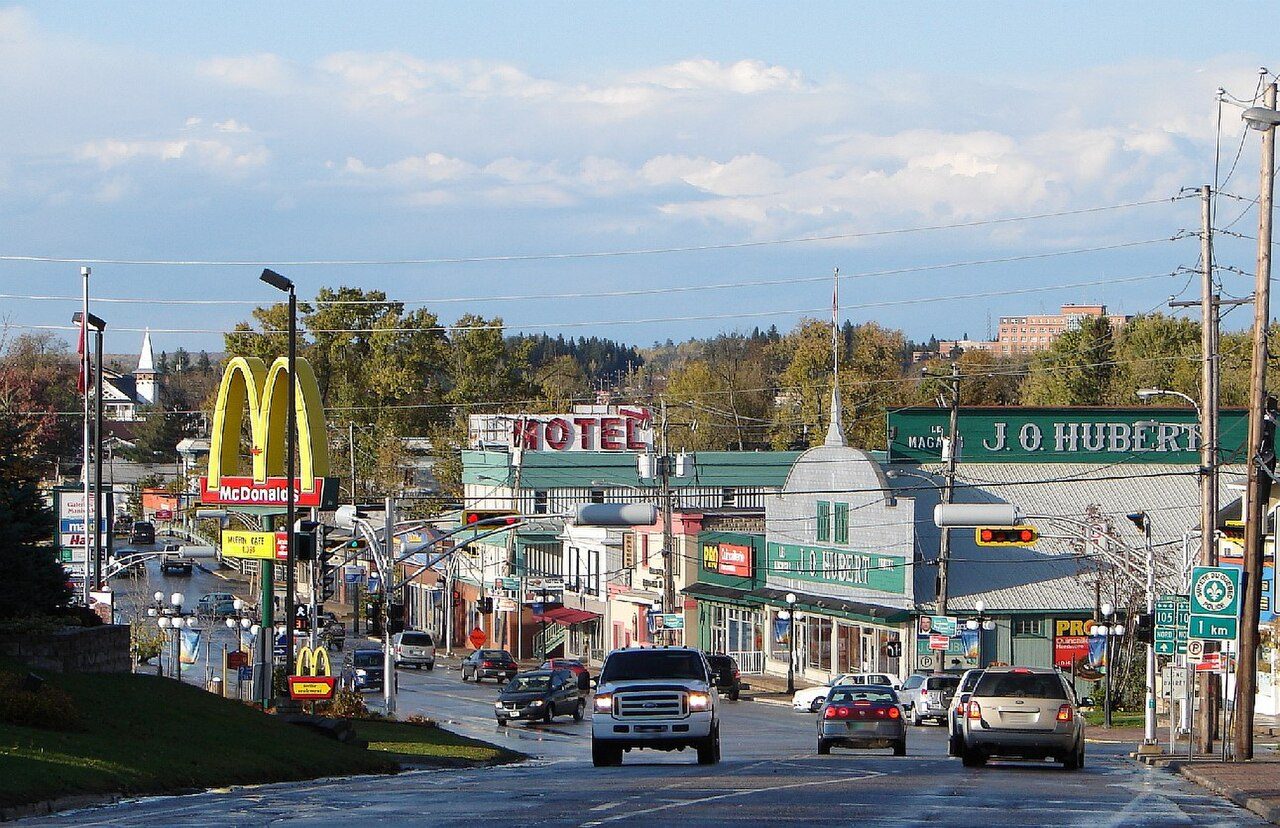 Photo: P199 · CC BY-SA 3.0
Biggest among them: lac des Trente et Un Milles White-Tailed Deer Yard, 24,354 ha, 5.5 km off. The 10 km around town hold one protected area. No national park lies within 100 km.
Each figure against the 2,611 Canadian towns and neighbourhoods of 2,500+ (not city hubs or reserves), with the town marked and the typical one’s line. No letter: the outdoors is described for Canadian towns, not graded.
CPCAD 2.9.0 (ECCC, 2026), OpenStreetMap (November 2026). Distances from the town’s outline.
The 40 Canadian towns nearest in population (3,728 to 3,874 residents), by the share of the land within 10 km that is protected. Hover for each one’s figures; click for its page.
Against towns its size, Maniwaki does best for protected land nearby: 15 of the other 39 have more. It trails them for public protected areas, where 34 of 39 have more.
| Town | Protected within 10 km | In town | Areas | Routes | Beaches | |
|---|---|---|---|---|---|---|
| 1 | Alnwick NB | 32% | 7.8% | 62 | 0 | 53 |
| 2 | L'Islet QC | 30% | 0.1% | 43 | 0 | 0 |
| 3 | Georgian Bay ON | 13% | 19% | 52 | 1 | 10 |
| 4 | Roberts Creek BC | 11% | 17% | 20 | 0 | 26 |
| 5 | Salisbury NB | 11% | 12% | 16 | 0 | 0 |
| 6 | Trend-Arlington ON | 10% | 0% | 22 | 1 | 5 |
| 7 | Saint-Maurice QC | 9.2% | 0.5% | 28 | 0 | 0 |
| 8 | Golf Course ON | 7.3% | 3% | 20 | 3 | 1 |
| 9 | Sainte-Marguerite-du-Lac-Masson QC | 5.9% | 0.1% | 14 | 0 | 2 |
| 10 | Saint-Tite QC | 5.8% | 0% | 12 | 0 | 0 |
| 11 | Saint-André-Avellin QC | 5.1% | 1.2% | 32 | 0 | 0 |
| 12 | Electoral Area A, Fraser-Fort George BC | 4.3% | 8.5% | 11 | 0 | 45 |
| 13 | Westville NS | 4.1% | 0% | 8 | 0 | 0 |
| 14 | Berrisfield ON | 3.4% | 0% | 19 | 3 | 0 |
| 15 | East Hawkesbury ON | 3.3% | 6.2% | 36 | 0 | 3 |
| 16 | Maniwaki QC | 3.2% | 0% | 1 | 0 | 1 |
| 17 | Electoral Area C, Fraser-Fort George BC | 3.1% | 3.3% | 15 | 1 | 32 |
| 18 | Eleanor ON | 3.1% | 0% | 14 | 1 | 0 |
| 19 | Lake Cowichan BC | 2.8% | 3.3% | 7 | 2 | 6 |
| 20 | Mulmur ON | 2.1% | 2.9% | 25 | 3 | 2 |
| 21 | Grand River North ON | 1.8% | 3.6% | 22 | 1 | 0 |
| 22 | Meadowgreen SK | 1.7% | 0% | 17 | 0 | 1 |
| 23 | Guernsey ON | 1.6% | 0% | 16 | 2 | 6 |
| 24 | Electoral Area C, Nanaimo BC | 1.5% | 1.1% | 60 | 6 | 47 |
| 25 | Stoney Creek ON | 1.5% | 0% | 14 | 4 | 8 |
| 26 | City Park SK | 1.3% | 0% | 14 | 0 | 3 |
| 27 | Pacific Heights SK | 1% | 0% | 15 | 0 | 1 |
| 28 | Corkery ON | 0.9% | 2.3% | 7 | 0 | 1 |
| 29 | Jamieson Place AB | 0.8% | 0% | 5 | 1 | 0 |
| 30 | Rosscarrock AB | 0.6% | 0% | 2 | 0 | 0 |
| 31 | Leila-McPhillips Triangle MB | 0.4% | 0% | 9 | 0 | 0 |
| 32 | Eau Claire AB | 0.4% | 0% | 2 | 1 | 1 |
| 33 | Meadows MB | 0.3% | 0% | 7 | 0 | 0 |
| 34 | Magrath Heights AB | 0.3% | 13% | 3 | 0 | 0 |
| 35 | Cartier MB | 0.2% | 0.5% | 4 | 1 | 0 |
| 36 | Penhold AB | 0.2% | 0% | 2 | 0 | 2 |
| 37 | Dixie ON | 0.2% | 0% | 5 | 1 | 5 |
| 38 | Clareview Town Centre AB | 0.2% | 0% | 2 | 1 | 0 |
| 39 | Cardston AB | 0.1% | 0% | 1 | 0 | 0 |
| 40 | Pleasantview AB | 0.1% | 0% | 2 | 0 | 1 |
The town’s parks, woods, protected land and paths, with its named places numbered.
Le parc de déléage is the largest, at 1.4 ha; the rest follow by size, numbered as on the map.
Two places, Le parc de déléage and Parc Imelda, make up 54% of the total.
Source: OpenStreetMap parks, gardens, commons and woods with a name, in the town or within 400 m, © OpenStreetMap contributors, ODbL. Sizes are the mapped outline’s.
Residents of each 2021 dissemination area, at a point inside it, within 400 m (about a 5-minute walk) of a park or playing field mapped on OpenStreetMap.
For comparison, the typical Canadian town has 83%. About 1,700 residents live further than 400 m from one.
Every protected and conserved area in CPCAD within 10 km of the town’s edge: parks, reserves, wildlife areas and conservation land.
It is public land.
Source: Canadian Protected and Conserved Areas Database (CPCAD) 2.9.0, Environment and Climate Change Canada. Contains information licensed under the Open Government Licence – Canada.
National parks (Parks Canada) and provincial or territorial parks by direction and distance from the town’s edge: every one within 10 km, and the nearest of each within 100 km.
For a national park, people in Maniwaki travel more than 100 km. Note that Québec calls its provincial parks parcs nationaux; Sépaq manages them.
Source: CPCAD 2.9.0 (ECCC): areas and outlines, distances outline to outline; directions from the town’s centre point.
OpenStreetMap footpaths, paths, bridleways and steps, and tracks open on foot, in the town and 1 km around it; woods as mapped (landuse=forest, natural=wood).
More of it is wooded than in 85% of Canadian towns. For path density, 71% of Canadian towns do better.
Source: OpenStreetMap, © OpenStreetMap contributors, ODbL. Mapping varies by place: a dense figure can mean keen local mappers as much as many paths.
Named walking and hiking routes on OpenStreetMap with at least 300 m within 2 km of the town, longest first; national routes lead.
OpenStreetMap has no named walking route within 2 km of the town. Trails may exist without being mapped as routes.
Source: OpenStreetMap (route relations hiking, foot and walking), © OpenStreetMap contributors, ODbL. Trans Canada Trail sections as OSM maps them.
Daylight at the town’s latitude and ECCC’s 1991–2020 normals (Maniwaki, 28 km away). Good months: long days, highs of 15–30 °C, light rain.
| Jan | Feb | Mar | Apr | May | Jun | Jul | Aug | Sep | Oct | Nov | Dec | |
|---|---|---|---|---|---|---|---|---|---|---|---|---|
| Daylight (h) | 9.0 | 10.3 | 11.8 | 13.5 | 15.0 | 15.8 | 15.4 | 14.2 | 12.5 | 10.8 | 9.3 | 8.6 |
| High (°C) | -6 | -4 | 2 | 10 | 19 | 23 | 26 | 24 | 20 | 12 | 4 | -3 |
| Rain & snow (mm) | 76 | 56 | 71 | 72 | 73 | 80 | 87 | 95 | 87 | 96 | 72 | 76 |
The wettest month, October, brings 96 mm, against 56 mm in February. Summer highs reach 26 °C in July; in January they stay near -6 °C. The climate in Maniwaki →
Beaches on OpenStreetMap within 5 km of the town’s edge, nearest first, with directions.
Water quality isn’t shown: there’s no open national record of beach tests. Local health authorities post advisories.
Source: OpenStreetMap (natural=beach), © OpenStreetMap contributors, ODbL.
Viewpoints, peaks, waterfalls, picnic sites, nature reserves, playgrounds, dog parks, campsites and boat launches mapped within 2 km of the town.
There are 8 playgrounds, more than of anything else.
Plus 1 picnic site without a name on the map.
Plus 8 playgrounds without a name on the map.
Plus 1 slipway without a name on the map.
Source: OpenStreetMap (tourism, natural, waterway and leisure tags), © OpenStreetMap contributors, ODbL.
The nearest places, coloured by the share of the land within 10 km that is protected; tap one for its outdoors page.
| Town | Protected within 10 km | Areas | Routes | Beaches |
|---|---|---|---|---|
| Maniwaki | 3.2% | 1 | 0 | 1 |
| Kitigan Zibi 3.6 km | 2.4% | 10 | 0 | 2 |
| Déléage 4.2 km | 17% | 15 | 0 | 3 |
| Messines 15 km | 5.2% | 11 | 0 | 6 |
Around Déléage the protected share is at least double.
Ottawa River Provincial Park, 90 km away.
On the normals, May to July and September: that is when days are long, highs reach 15 °C and rain is light.
lac des Trente et Un Milles White-Tailed Deer Yard: 24,354 ha, a protected area.
There is an unnamed beach within 5 km.
Yes: 3.2% of the land within 10 km is protected.
No national park lies within 100 km of Maniwaki.
Protected areas: Canadian Protected and Conserved Areas Database (CPCAD) 2.9.0, Environment and Climate Change Canada, 2026: every area within 10 km and the nearest national and provincial parks, measured outline to outline.
Walking routes and beaches: OpenStreetMap, November 2026: named hiking, foot and walking route relations within 2 km and beaches within 5 km.
Towns: Statistics Canada 2021 Census boundaries and populations; the comparison is the Canadian towns and neighbourhoods of 2,500+, not city hubs or reserves.
When to go: Environment and Climate Change Canada, Canadian Climate Normals 1991–2020, from the nearest station that publishes them.
Green space, paths, woods, things to do: OpenStreetMap (Geofabrik’s Canada extract), November 2026: parks, gardens, playing fields, woods, footpaths, the coastline and things to do in and around each town.
Residents: Statistics Canada 2021 Census dissemination areas (population, boundaries), each at a point inside it.
Walking routes and beaches © OpenStreetMap contributors, available under the Open Database Licence (ODbL).
Not on this page: trailheads and trail grades, and beach water quality. No open Canadian dataset gives these for every town yet.
Adapted from Statistics Canada (Census of Population 2021, population estimates 2025, 2021 census boundaries) under the Statistics Canada Open Licence; this does not constitute an endorsement by Statistics Canada. Neighbourhood names in some cities © OpenStreetMap contributors (ODbL).