First pick
Parc Donald-Bricault
Park or garden
2.5 ha
0.8 km eastfrom the centre
Directionsto a point inside
Each edition grades its towns against each other only.
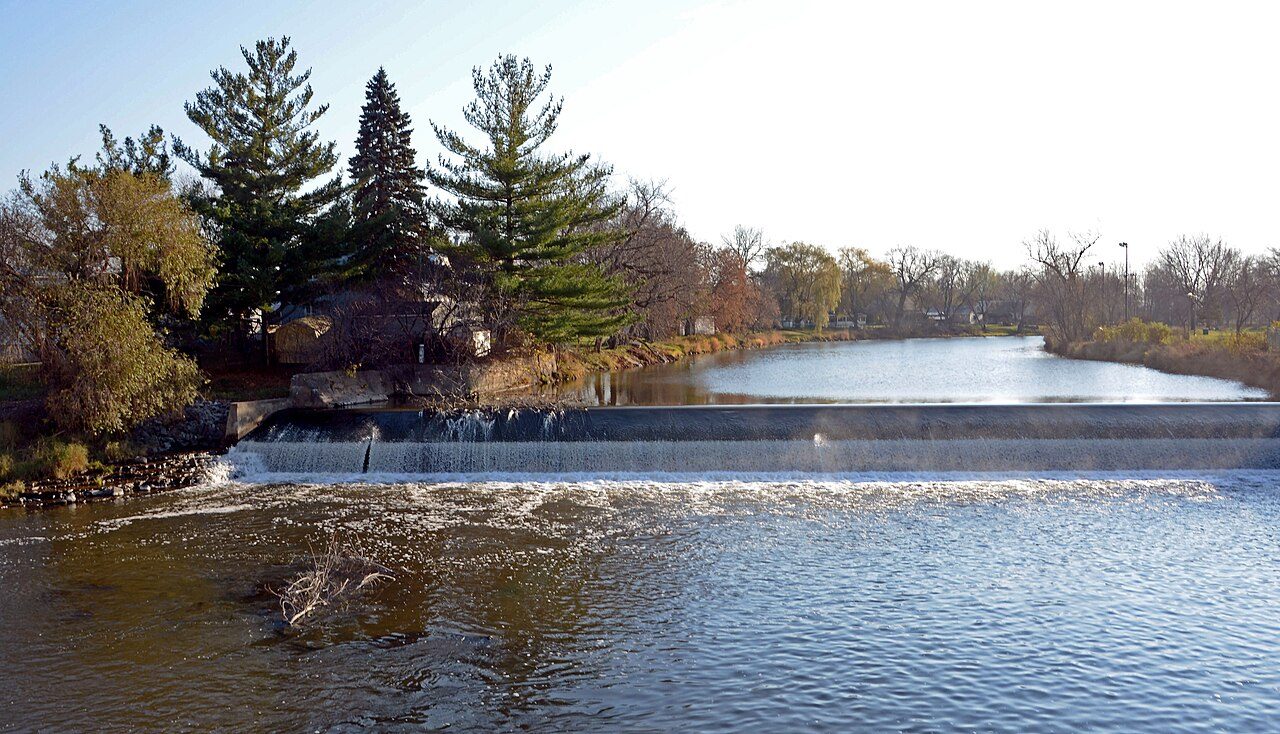 Photo: Jarmuz · CC BY-SA 4.0
fleuve Saint-Laurent (Îles de Verchères) Water Fowl Gathering Area (2,095 ha) is the biggest, 7.4 km from town. Within 10 km of the town, 4% of the land is protected, against 2.3% around a typical Canadian town. A drive of 92 km reaches La Mauricie National Park, the nearest national park.
Each figure against the 2,611 Canadian towns and neighbourhoods of 2,500+ (not city hubs or reserves), with the town marked and the typical one’s line. There is no Outdoors grade for Canadian towns; the figures stand beside the country’s towns of 2,500+ without a letter.
CPCAD 2.9.0 (ECCC, 2026), OpenStreetMap (November 2026). Distances from the town’s outline.
The 40 Canadian towns nearest in population (9,084 to 9,464 residents), by the share of the land within 10 km that is protected. Hover for each one’s figures; click for its page.
Against towns its size, L'Épiphanie does best for public protected areas: 14 of the other 39 have more.
| Town | Protected within 10 km | In town | Areas | Routes | Beaches | |
|---|---|---|---|---|---|---|
| 1 | Three Rivers PE | 31% | 4.4% | 64 | 14 | 42 |
| 2 | La Pêche QC | 19% | 8.3% | 33 | 0 | 12 |
| 3 | Revelstoke BC | 16% | 0.3% | 5 | 0 | 0 |
| 4 | Mount Royale NS | 15% | 24% | 18 | 5 | 14 |
| 5 | Braemar Park-Belair Heights-Copeland Park ON | 13% | 1.7% | 30 | 2 | 7 |
| 6 | Fall River NS | 11% | 2.9% | 26 | 1 | 4 |
| 7 | Centrepointe - Briargreen ON | 11% | 0% | 26 | 1 | 5 |
| 8 | Beaver Bank NS | 8.2% | 3.8% | 31 | 2 | 6 |
| 9 | Burnaby Mountain BC | 8.1% | 0% | 36 | 2 | 84 |
| 10 | Saint-Robert QC | 7.8% | 0% | 22 | 0 | 4 |
| 11 | Oromocto NB | 6.6% | 3.8% | 19 | 0 | 5 |
| 12 | Strathcona ON | 6% | 13% | 26 | 1 | 3 |
| 13 | Boischatel QC | 5.9% | 0% | 25 | 0 | 6 |
| 14 | Vankleek Hill ON | 5.2% | 0.1% | 19 | 0 | 4 |
| 15 | Saint-Apollinaire QC | 5.1% | 0% | 23 | 0 | 1 |
| 16 | Sulphur Springs ON | 5.1% | 36% | 20 | 3 | 1 |
| 17 | Otterburn Park QC | 5% | 0% | 23 | 0 | 3 |
| 18 | L'Épiphanie QC | 4% | 0% | 16 | 0 | 0 |
| 19 | Walsh Acres/Lakeridge/Garden Ridge SK | 3.6% | 0% | 5 | 0 | 0 |
| 20 | Thistletown-Beaumond Heights ON | 3.2% | 0% | 8 | 0 | 0 |
| 21 | North Central SK | 3.2% | 0% | 5 | 2 | 1 |
| 22 | Riverbend AB | 3.1% | 0% | 3 | 0 | 8 |
| 23 | Fletchers Meadow South ON | 2.7% | 11% | 8 | 1 | 0 |
| 24 | Old East York ON | 2.4% | 4.6% | 13 | 3 | 15 |
| 25 | Stony Mountain MB | 2.3% | 2.3% | 12 | 4 | 1 |
| 26 | Danforth ON | 2.3% | 0% | 13 | 4 | 24 |
| 27 | Elms-Old Rexdale ON | 1.9% | 0% | 8 | 0 | 0 |
| 28 | Sainte-Brigitte-de-Laval QC | 1.7% | 0% | 24 | 0 | 2 |
| 29 | Portugal Cove-St. Philip's NL | 1.5% | 0% | 3 | 2 | 35 |
| 30 | Stoney Creek ON | 1.3% | 0% | 10 | 1 | 0 |
| 31 | Hampton Village SK | 1.2% | 0% | 14 | 0 | 2 |
| 32 | University Heights Urban Centre SK | 0.9% | 0% | 12 | 1 | 3 |
| 33 | Barbertown ON | 0.8% | 0% | 3 | 0 | 0 |
| 34 | Hawkwood AB | 0.5% | 0% | 1 | 0 | 2 |
| 35 | La Salle MB | 0.4% | 0% | 25 | 0 | 1 |
| 36 | Downtown Commercial Core AB | 0.4% | 0% | 2 | 1 | 1 |
| 37 | Amber Trails MB | 0.3% | 0% | 6 | 0 | 0 |
| 38 | Mount Pleasant AB | 0.3% | 0% | 2 | 1 | 1 |
| 39 | Silver Berry AB | 0.2% | 0% | 2 | 0 | 3 |
| 40 | Cooksville NHD (East) ON | 0.1% | 0% | 2 | 0 | 3 |
The town’s parks, woods, protected land and paths, with its named places numbered.
Parc Donald-Bricault is the largest, at 2.5 ha; the rest follow by size, numbered as on the map.
Most of it sits in Parc Donald-Bricault and Parc du Barrage: 57% together.
Source: OpenStreetMap parks, gardens, commons and woods with a name, in the town or within 400 m, © OpenStreetMap contributors, ODbL. Sizes are the mapped outline’s.
Residents of each 2021 dissemination area, at a point inside it, within 400 m (about a 5-minute walk) of a park or playing field mapped on OpenStreetMap.
Around 4,300 residents are further than 400 m from a park. That is below the typical Canadian town (83%).
Every protected and conserved area in CPCAD within 10 km of the town’s edge: parks, reserves, wildlife areas and conservation land.
On public land: 7 of the 16. The others are private conservation land. fleuve Saint-Laurent (Îles de Verchères) Water Fowl Gathering Area leads for size with 2,095 ha. Another 9 are privately owned conservation land; they count in the figures but aren’t named, as private land isn’t a place to visit.
Source: Canadian Protected and Conserved Areas Database (CPCAD) 2.9.0, Environment and Climate Change Canada. Contains information licensed under the Open Government Licence – Canada.
National parks (Parks Canada) and provincial or territorial parks by direction and distance from the town’s edge: every one within 10 km, and the nearest of each within 100 km.
A provincial park is closer: Îles-de-Boucherville National Park (Québec), at 18 km. Québec’s “national” parks are the province’s own, managed by Sépaq.
Source: CPCAD 2.9.0 (ECCC): areas and outlines, distances outline to outline; directions from the town’s centre point.
OpenStreetMap footpaths, paths, bridleways and steps, and tracks open on foot, in the town and 1 km around it; woods as mapped (landuse=forest, natural=wood).
95% of Canadian towns have more footpath per km². It is more wooded than 76% of Canadian towns.
Source: OpenStreetMap, © OpenStreetMap contributors, ODbL. Mapping varies by place: a dense figure can mean keen local mappers as much as many paths.
Named walking and hiking routes on OpenStreetMap with at least 300 m within 2 km of the town, longest first; national routes lead.
OpenStreetMap has no named walking route within 2 km of the town. Trails may exist without being mapped as routes.
Source: OpenStreetMap (route relations hiking, foot and walking), © OpenStreetMap contributors, ODbL. Trans Canada Trail sections as OSM maps them.
Environment and Climate Change Canada’s 1991–2020 normals from Fleury (39 km), and daylight at the town’s latitude. Good months: 12½+ hours of daylight, highs of 15–30 °C, little rain.
| Jan | Feb | Mar | Apr | May | Jun | Jul | Aug | Sep | Oct | Nov | Dec | |
|---|---|---|---|---|---|---|---|---|---|---|---|---|
| Daylight (h) | 9.0 | 10.3 | 11.8 | 13.5 | 14.9 | 15.7 | 15.4 | 14.1 | 12.5 | 10.8 | 9.4 | 8.7 |
| High (°C) | -6 | -4 | 2 | 11 | 19 | 24 | 27 | 26 | 21 | 13 | 5 | -2 |
| Rain & snow (mm) | 81 | 61 | 71 | 96 | 98 | 102 | 106 | 114 | 97 | 108 | 90 | 85 |
In July the typical high is 27 °C; in January, -6 °C. Precipitation runs from 61 mm in February to 114 mm in August. A typical year sees 202 cm of snow. The climate in L'Épiphanie →
Viewpoints, peaks, waterfalls, picnic sites, nature reserves, playgrounds, dog parks, campsites and boat launches mapped within 2 km of the town.
There are 8 playgrounds, more than of anything else.
Plus 1 picnic site without a name on the map.
Plus 8 playgrounds without a name on the map.
Plus 1 campsite without a name on the map.
Source: OpenStreetMap (tourism, natural, waterway and leisure tags), © OpenStreetMap contributors, ODbL.
The nearest places, coloured by the share of the land within 10 km that is protected; tap one for its outdoors page.
| Town | Protected within 10 km | Areas | Routes | Beaches |
|---|---|---|---|---|
| L'Épiphanie | 4% | 16 | 0 | 0 |
| L'Assomption 5.5 km | 8.5% | 40 | 0 | 0 |
| Saint-Roch-de-l'Achigan 7.9 km | 0.3% | 2 | 0 | 0 |
| Sainte-Marie-Salomé 8.1 km | 0.1% | 2 | 0 | 0 |
| Saint-Sulpice 10 km | 12% | 29 | 0 | 0 |
| Repentigny 10 km | 8.3% | 41 | 0 | 2 |
| Saint-Jacques 13 km | 0.3% | 3 | 0 | 0 |
Around L'Assomption, Saint-Sulpice and Repentigny the protected share is at least double.
On the normals, May to July and September: that is when days are long, highs reach 15 °C and rain is light.
fleuve Saint-Laurent (Îles de Verchères) Water Fowl Gathering Area, a wildlife area of 2,095 ha.
Îles-de-Boucherville National Park (Québec), 18 km away.
Within 10 km, 4% of the land lies in protected areas.
La Mauricie National Park, 92 km from the edge of town.
Protected areas: Canadian Protected and Conserved Areas Database (CPCAD) 2.9.0, Environment and Climate Change Canada, 2026: every area within 10 km and the nearest national and provincial parks, measured outline to outline.
Walking routes and beaches: OpenStreetMap, November 2026: named hiking, foot and walking route relations within 2 km and beaches within 5 km.
Towns: Statistics Canada 2021 Census boundaries and populations; the comparison is the Canadian towns and neighbourhoods of 2,500+, not city hubs or reserves.
When to go: Environment and Climate Change Canada, Canadian Climate Normals 1991–2020, from the nearest station that publishes them.
Green space, paths, woods, things to do: OpenStreetMap (Geofabrik’s Canada extract), November 2026: parks, gardens, playing fields, woods, footpaths, the coastline and things to do in and around each town.
Residents: Statistics Canada 2021 Census dissemination areas (population, boundaries), each at a point inside it.
Walking routes and beaches © OpenStreetMap contributors, available under the Open Database Licence (ODbL).
Not on this page: trailheads and trail grades, and beach water quality. No open Canadian dataset gives these for every town yet.
Adapted from Statistics Canada (Census of Population 2021, population estimates 2025, 2021 census boundaries) under the Statistics Canada Open Licence; this does not constitute an endorsement by Statistics Canada. Neighbourhood names in some cities © OpenStreetMap contributors (ODbL).