
East River, Part 1Prince Edward Island
It grew by 11% between the 2016 and 2021 censuses. This town on Prince Edward Island has a population of 2,657.
Is East River, Part 1 a good place to live?
Jobs & income is where it shines (A−). It is a safe place by the numbers (A−). Most journeys need a car (D). The overall grade lands at B+, #5 of 10 on Prince Edward Island. Set against the rest, it does better than 66% of Canadian towns. Its other grades sit near the middle: C+ for cost of living and B− for health.
Safety is the police detachment's figure, shared with the towns and countryside around it. No School Grade: this province doesn't publish comparable results school by school. Health is graded on the health region's survey figures and life expectancy, with the distance to hospital giving the town its own spread.
What makes East River, Part 1 stand out
The 3 things East River, Part 1 does most differently from other towns.
How East River, Part 1 grades
Each subject compares East River, Part 1 with Canadian towns of 2,500 or more, ordered by how far it is from the middle. Towns in other countries are graded separately.
How TownRatings grades Canadian towns →
The data
Data highlights are ordered by what stands out in East River, Part 1.
East River, Part 1’s teenagers travel 81 km to the nearest high school
From the middle of town, the first elementary school is 71 km off, above Prince Edward Island’s towns (56 km) and Canadian towns (0.5 km) alike.
| School | Level | Students | System |
|---|---|---|---|
| Mount Stewart Consolidated SchoolIn East River, Part 1Elementary | Elementary | – | English public |
| Schools within 3 km | East River, Part 1 | Prince Edward Island | Canada |
|---|---|---|---|
| Nearest secondary school | 81 km | 76 km | 1.2 km |
| Nearest elementary school | 71 km | 56 km | 0.5 km |
Statistics Canada’s Open Database of Educational Facilities · Source note: the province publishes no results school by school, so there’s no schools grade on Prince Edward Island.
East River, Part 1 faces fewer hazards than 87% of Canadian towns
Source area for radon tests: the Prince Edward Island Health Region
Flood mapping exists: 2 studies, most recently by Department of Environment, Energy and Climate Action - Government of Prince Edward Island. Radon is lower than usual: 3.5% of tested homes in the survey area topped the guideline, against 6.6% for the typical town. Seismic risk in East River, Part 1 sits near the middle: $0.020 of expected damage per $1,000 of buildings a year, the typical town $0.030.
Radon tests above the guideline · share of tested homes, 200 Bq/m³
| Hazards | East River, Part 1 | Prince Edward Island | Canada |
|---|---|---|---|
| Radon tests above the guideline | 3.5% | 3.5% | 6.6% |
| Earthquake loss per $1,000 of buildings a year | $0.020 | $0.020 | $0.030 |
NRCan seismic risk model and burned areas, Health Canada radon survey, the Flood Hazard Map Inventory
More of East River, Part 1’s 15-to-64s are in work than in 94% of Canadian towns
The average trip to work took 26 min, above Prince Edward Island’s towns (23 min) and close to Canadian towns (26 min).
How working residents got to work · census 2021
| Census 2021 | East River, Part 1 | Prince Edward Island | Canada |
|---|---|---|---|
| Average trip | 26 min | 23 min | 26 min |
Statistics Canada, Census 2021 (labour and commuting) · Counted in May 2021, under pandemic rules: fewer commutes and more people between jobs than in a normal year.
East River, Part 1 earns an A− for safety
For violence alone, its police area’s index was 51, below Prince Edward Island’s towns (54) and Canadian towns (86) alike. Across its police area, there are 16.3 property incidents per 1,000 residents a year. Figures for Crime Severity Index, Violent Crime Severity Index, violent crime and property crime per 1,000 are published for the Queens District detachment area as a whole, not for East River, Part 1 alone.
Year by year · Crime Severity Index for each year
| 2023–2025 | East River, Part 1 | Prince Edward Island | Canada |
|---|---|---|---|
| Property crime per 1,000 | 16.3 | 19.4 | 31.2 |
| Violent Crime Severity Index | 51 | 54 | 86 |
| Crime Severity Index | 47 | 47 | 67 |
Statistics Canada, Uniform Crime Reporting Survey, 2023–2025 average
More rain and snow fall on East River, Part 1 than on 83% of Canadian towns: 1,136 mm a year
The warmest afternoons come in July, at around 23.6°C in East River, Part 1. Snow totals 285 cm over the year, close to Prince Edward Island’s towns (285 cm) and above Canadian towns (141 cm). The most precipitation falls in October: 122 mm in a normal year. Most of the snow comes in January, about 73 cm.
Average high by season · ECCC normals, 1991–2020
| Normals, 1991–2020 | East River, Part 1 | Prince Edward Island | Canada |
|---|---|---|---|
| Snowfall a year | 285 cm | 285 cm | 141 cm |
| July afternoon high | 23.6°C | 23.7°C | 25.5°C |
| Precipitation a year | 1,136 mm | 1,136 mm | 883 mm |
| January night low | −11.5°C | −11.4°C | −13.5°C |
Environment and Climate Change Canada, Canadian Climate Normals 1991–2020 (Charlottetown (Airport))
Shelter costs push only 8% of East River, Part 1’s households past 30% of income, fewer than the 18% of the typical Canadian town
Home ownership covers 93% of households. Rent took 20% of household income, above Prince Edward Island’s towns (18%) and close to Canadian towns (20%). Nobody publishes rent as a share of income and monthly rent for a two-bedroom for East River, Part 1 alone, so this card uses the figure for the Charlottetown metro area.
What homes were worth · The median owner’s estimate at the 2021 census
| Census 2021 | East River, Part 1 | Prince Edward Island | Canada |
|---|---|---|---|
| Households spending 30%+ on shelter | 8% | 11% | 18% |
| Households owning their home | 93% | 86% | 74% |
Statistics Canada, Census 2021; CMHC Rental Market Survey via Statistics Canada · Values come from owners at the 2021 census and incomes from 2020, so they predate the later rise in rates.
A town of families: 18% of people in East River, Part 1 are under 15, more than in Prince Edward Island’s towns or Canadian towns
Immigrants make up 3.5% of residents, lower than both Prince Edward Island’s towns (4.9%) and Canadian towns (6.4%). The 65-and-over age group makes up 19% of residents.
Ages · Share of residents in each age group, Census 2021
Schooling · Highest qualification, residents 15 and over
Women and men · all residents
Women make up 49.0% of East River, Part 1
Women numbered 1,130 and men 1,175 in 2021, next to a 50.9% share of women for Canada.
| East River, Part 1 | Prince Edward Island | Canada | |
|---|---|---|---|
| Under 15 | 18% | 17% | 16% |
| 15 to 64 | 62% | 63% | 64% |
| 65+ | 19% | 19% | 19% |
| No certificate, diploma or degree | 14% | 14% | 16% |
| Postsecondary qualification | 61% | 61% | 56% |
Statistics Canada, Census 2021; Prince Edward Island and Canada: medians of towns of 2,500+
Expect November days around 7°C in East River, Part 1, nights around freezing
July brings the warmest days, 24°C; February the coldest nights, −12°C. Next comes December, with normal highs of 1°C and lows of −6°C. November normally sees 110 mm of precipitation. Snow is normal by November, about 21 cm over the month.
Normal highs, the months ahead · ECCC normals, 1991–2020
| Season | High | Low | Rain and snow |
|---|---|---|---|
| Winter | −2°C | −10°C | 302 mm |
| Spring | 8°C | −1°C | 237 mm |
| Summer | 22°C | 13°C | 269 mm |
| Autumn | 13°C | 5°C | 327 mm |
ECCC normals, 1991–2020 (Charlottetown (Airport)); the forecast is on the Weather page
East River, Part 1 sends Kent MacDonald (Liberal Party of Canada) to the Commons from Cardigan
Of the 4 Commons seats from Prince Edward Island, the Liberal Party of Canada holds 4.
Wikidata, MAMH, MMAH, Statistics Canada
No public library stands in East River, Part 1: the closest, Stratford Public Library, is 17 km away
After it comes Robertson Library (Charlottetown), 18 km away.
Provincial library statistics, OpenStreetMap, the CRA and Statistics Canada
Very good or excellent health for 51% of adults in East River, Part 1’s health region
The health survey and life expectancy numbers here cover the Prince Edward Island health region
For East River, Part 1 itself the measure is access, and it lags: 14 km to the nearest hospital, where 3.7 km is typical. Women in the region live to 83.3 and men to 79.1, 81.2 years taken together (2022/2024).
Very good or excellent health · adults, age-standardised
| Health | East River, Part 1 | Prince Edward Island | Canada |
|---|---|---|---|
| Very good or excellent health | 51% | 51% | 52% |
| Life expectancy at birth | 81.2 | 81.2 | 81.5 |
Statistics Canada, Canadian Community Health Survey 2023/2024 and life expectancy 2022/2024; Open Database of Healthcare Facilities
The boundary of Prince Edward Island National Park runs along East River, Part 1
CPCAD lists 38 protected areas within 10 km. The closest provincial park is Brudenell Provincial Park, 17 km from the edge of town. Biggest among them: Egmont Bay PEI Conservation Agreement, 2,958 ha, 1.4 km off. Some protected land is inside the town: 9.1% of its area.
Protected land · of the land within 10 km
| Outdoors | East River, Part 1 | Prince Edward Island | Canada |
|---|---|---|---|
| Public protected areas within 10 km | 15 | 7 | 4 |
| Protected land within 10 km | 4.3% | 4% | 2.3% |
Canadian Protected and Conserved Areas Database (CPCAD), OpenStreetMap routes and beaches
Prince Edward Island National Park and 4 more within 40 km
Nothing to visit is mapped within 5 km of East River, Part 1; these are the best known within 40 km.
 National park · Parks CanadaPrince Edward Island National Park20 km northwest
 ChurchSt. Dunstan's Roman Catholic Basilica19 km southwest
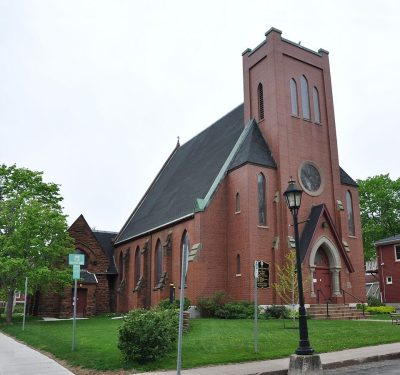 CathedralSt. Peter's Cathedral19 km southwest
 MuseumFarmers' Bank of Rustico31 km west
 FortSkmaqn–Port-la-Joye–Fort Amherst22 km southwest
Photos: each place’s Wikidata image, from Wikimedia Commons under the licence below (our copy, resized).
Photo credits (5)
- Prince Edward Island National Park: Rick McCharles, CC BY 2.0, Wikimedia Commons
- St. Dunstan's Roman Catholic Basilica: SoftwareSimian (changes by Rabanus Flavus ), CC BY-SA 4.0, Wikimedia Commons
- St. Peter's Cathedral: Robert Cutts from Bristol, England, UK, CC BY-SA 2.0, Wikimedia Commons
- Farmers' Bank of Rustico: Fralambert, CC BY-SA 3.0, Wikimedia Commons
- Skmaqn–Port-la-Joye–Fort Amherst: MTLskyline, CC BY-SA 3.0, Wikimedia Commons
Everything we know about East River, Part 1
Famous people from around East River, Part 1
One notable person was born in East River, Part 1; with them, the best known born in the towns around it.


Photo credits
John Alexander Macdonald: Charlottetown Guardian, Public domain · Wade MacLauchlan: U.S. Department of Agriculture, Public domain · Francis Kelley: Bain News Service, publisher, Public domain · Andrew Macphail: Unknown author, Public domain · Neil McLeod: Unknown author, Public domain
East River, Part 1’s neighbours
The nearest places of 1,000 or more. Statistics Canada
| Town | People | km | Overall | Cost | Safety | Health |
|---|---|---|---|---|---|---|
| East River, Part 1 | 2,657 | — | B+ | C+ | A− | B− |
| Vernon River | 2,779 | 11 | B | B+ | A− | B− |
| North Shore | 1,609 | 11 | — | B | A− | B |
| Crossroads | 2,366 | 11 | — | B | A− | B |
| North Shore | 2,994 | 14 | A− | B− | A− | B− |
| Morell | 1,422 | 16 | — | A | B− | B− |
| Stratford | 13,152 | 17 | B+ | C | B+ | B |
People: Statistics Canada, Census 2021. Distances: centre to centre.
Questions about East River, Part 1
Has East River, Part 1 grown?
It grew from 2,085 people in 2016 to 2,307 in 2021, up 10.6%; the median of Canadian towns grew 4.1%. StatCan’s 2025 estimate is 2,657.
Who are the people of East River, Part 1?
Visible minorities are 2% of the population, where the middle of Canadian towns is 15%. Immigrants make up 4%, and Indigenous people 4%.
What kind of homes are in East River, Part 1?
Households hold 2.5 people on average, and 22% have just one.
Is East River, Part 1 a young town or an old one?
Its median age is 41.2, where Canadian towns sit at 45.2. Under-15s are 18% of residents; over-65s, 19%.
About East River, Part 1
Town in Prince Edward Island
For East River, Part 1, TownRatings uses Statistics Canada’s census-subdivision boundary on Prince Edward Island, and every figure on its pages covers that whole area.
Statistics Canada: population estimates 2025 (17-10-0155), Census of Population 2021, 2021 census boundaries.
- Population
- 2,657 (people, 2025 estimate)
- Province or territory
- Prince Edward Island
- Census division
- Queens
- Metro area
- Charlottetown
- Census subdivision
- 1102064
Sources: Statistics Canada, Census of Population 2021 · population estimates 2025 (17-10-0155) and 2021 census boundaries · Uniform Crime Reporting Survey 2023–25 (35-10-0026, 35-10-0183 to 35-10-0190) · CMHC rents as published by Statistics Canada (34-10-0133) · grades by TownRatings. Under the Statistics Canada Open Licence.
Adapted from Statistics Canada (Census of Population 2021, population estimates 2025, 2021 census boundaries) under the Statistics Canada Open Licence; this does not constitute an endorsement by Statistics Canada. Neighbourhood names in some cities © OpenStreetMap contributors (ODbL).