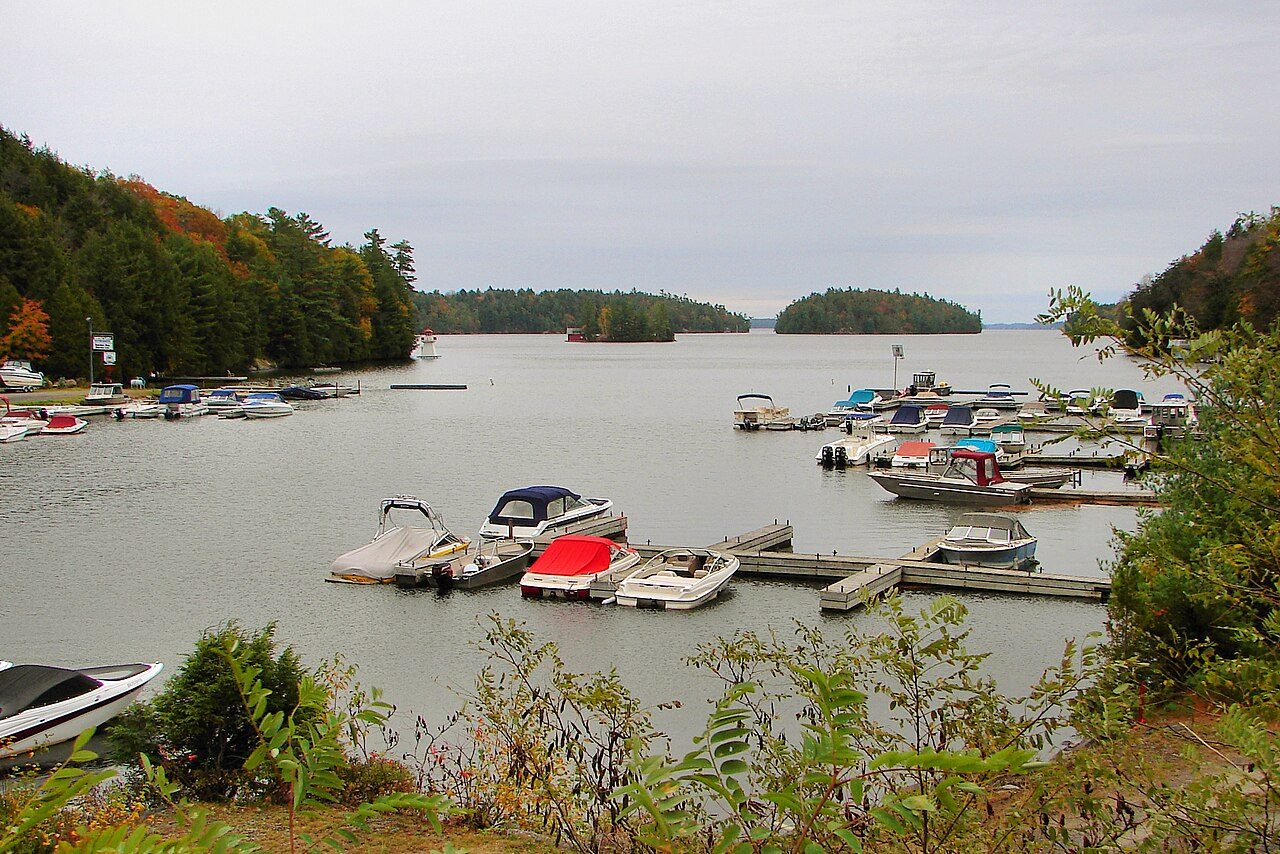
 Photo: P199 · CC BY-SA 3.0
Seguin is older than 95% of Canadian towns: a median age of 54.8
11% of residents are under 15 (Canada’s towns: 16%). Seguin is home to some 5,761 people (July 2025 estimate), in 2,135 households at the 2021 Census. The census found that one in ten households rent their home here. More residents with no religion than in 78% of Canadian towns: 45%.
What stands out about the people of Seguin
Older than most towns
Seguin’s median age is 54.8; the typical median across Canadian towns is 42. 29% are 65 or over, against 19% across Canada’s towns. Ages ↓
Growing faster than most
Seguin went from 4,304 people in 2016 to 5,280 in 2021, +23%: faster growth than in 97% of Canadian towns. Population change ↓
Written from the data on this page: Statistics Canada, 2021 Census.
Seguin grew +23% from 2016 to 2021, faster than 97% of Canadian towns
All figures are the 2021 Census’s unless another date is shown. Two census counts, five years apart, and Statistics Canada’s newest estimate.
Change, 2016 to 2021
Across Ontario’s towns the median is +6%, and across Canada’s towns +4%. By July 2025, the estimate had risen a further 9%.
Seguin: 29% of residents are 65 or over, above 89% of Canadian towns
Every five-year age group as a share of residents; ticks mark the typical town.
Against a figure of 11% across Canada’s towns, the share of residents aged 15 to 24 in Seguin comes in at 9.7%. Set beside that, 19% of residents are 65 or over across Canada’s towns.
Median age of Canadian towns of 2,500+
■ Seguin, 54.8. The typical town is 42.
Broad ages · share of residents
Women and men · all residents
47% women, 53% men
About 113 men for every 100 women.
Seguin households average 2.3 people, smaller than in 64% of Canadian towns
Private households by type and size.
Against Ontario’s towns and Canada’s towns
People per household
Canada’s towns.
In Seguin, 4.9% of households are one-parent families, beside 8.2% across Canada’s towns. On the census count, 27% of households are one person living alone.
In Seguin, 54% of residents 15 and over are married, more than in 74% of Canadian towns
How adults live as couples, or don’t, with common-law unions shown on their own.
Marital status · residents 15 and over
Single and never married: 21% of adults, against a typical 27%. Elsewhere, 46% of residents 15 and over are married across Canada’s towns. Common-law partners: a tenth of the total.
More households in single-detached houses than 98% of Canadian towns: 97%
The kinds of homes people live in, who owns and who rents, and how old the homes are. Prices, rents and shelter costs are on Cost of living.
Type of home
Owners and renters · share of households
When homes were built · share of homes
Nearly one in ten homes need major repairs, against a typical 5.8%. Households in single-detached houses make up 64% across Canada’s towns. Newer homes outnumber old: 23% date from 2001 or later, 20% from before 1961.
Households here have a median income of $84,000 a year
Incomes are 2020’s, the census’s reference year, and include pandemic benefits such as CERB. What households took in before tax, at the middle and across income groups.
Households by income · share of households
At $84,000, the middle household in Seguin earned close to the median across Canada’s towns ($86,000). The figure for Ontario’s towns: $91,600. Emergency and recovery benefits reached 22% of those with an income, beside a typical 28%.
Residents who moved in within the year: 8.1%, a lower share than 81% of Canadian towns
Birthplaces and arrival years of immigrants, citizenship and recent moves.
Immigrants, by continent of birth · share of all residents; the bar runs to 35%
When immigrants arrived · share of immigrants
Citizenship and moving · share of residents
The largest groups of immigrants were born in Europe (68%) and in the Americas (18%). Immigrants are rarer here than in 69% of Canadian towns. Set beside that, just over one in ten residents lived at another address a year earlier across Canada’s towns. Of the immigrants living here, 3.7% came between 2011 and 2021; across Canada’s towns the share is 27%.
Indigenous residents: 4.5%, a higher share than 67% of Canadian towns
Visible minority, Indigenous identity and religion, as residents answered the census.
Visible minority and Indigenous identity · all residents
Religion · all residents
Where 15% of residents belong to a visible minority across Canada’s towns, Seguin has 1.7%. Indigenous residents: 2.8% across Canada’s towns, for comparison.
English is the mother tongue of 93%, and 4% speak French as well
Who can speak English and French, mother tongue, and the language spoken most at home.
Can hold a conversation in · share of all residents
Mother tongue · share of all residents
At 1%, the share of residents whose mother tongue is French is in line with the figure across Canada’s towns. Fewer bilingual residents than in 86% of Canadian towns: 4%.
In Seguin, 20% of residents 25 to 64 hold a bachelor’s degree or higher, fewer than in 66% of Canadian towns
From no certificate to a master’s: residents 25 to 64.
Highest qualification · residents 25 to 64
No diploma or degree: 6.5% here, 9.5% in the typical town. For comparison, 27% of residents 25 to 64 hold a bachelor’s degree or higher across Canada’s towns.
52% of adults were employed in May 2021
Counted in May 2021, during COVID-19, these rates catch the job market before it had recovered. Four labour figures from the census. Jobs, industries and the commute are on Work & commute.
Across Canada’s towns the typical rate is 58%, above this 52%; 29% of residents are 65 or over.
Oldest by rank: 4th of 41 towns of 5,663 to 5,843 people
Towns of about this size, placed by median age.
Osoyoos is the oldest at 63.2, Montcalm the youngest at 27.8. The closest ages to Seguin’s belong to Vieux-Québec—Cap-Blanc—Colline parlementaire (52.2), Havelock (54.4), Duncan (55.6) and Chertsey (56).
Around Seguin, 1 of 2 towns have a higher median age
The nearest places, coloured by median age; each links to its own page.
| Town | People | Away | Median age | 65+ | Immigrants |
|---|---|---|---|---|---|
| Seguin | 5,761 | — | 54.8 | 29% | 8.4% |
| McKellar | 1,534 | 16.5 km | 60.4 | 37% | 12% |
| Parry Sound | 7,584 | 18.1 km | 53.2 | 32% | 7.5% |
Health, work, housing and schools
What this data can and can’t tell you
- Against Ontario’s towns and Canada’s towns. Each comparison is its own median: over Ontario’s towns and neighbourhoods of 2,500 or more, and over all Canadian towns of that size (whole cities and First Nations reserves left out). Percentiles are within Canada only.
- What these tables don’t give. For origins the charts stop at visible minority and Indigenous identity, and the Census Profile has nothing on unpaid care, cars or the internet, or on change by age since 2016.
- The census’s own words. The census takes “visible minority” from the Employment Equity Act: anyone other than Indigenous peoples who is non-white in colour or race. Indigenous identity, immigrant status and religion are what residents reported, compared here with other towns and never used as a label.
Questions about Seguin’s residents
What religion are people in Seguin?
Most often Christian (54%) or no religion (45%); other religions make up 1.6%.
Is Seguin good for families?
Children under 15 are 11% of residents, against 16% across Canada’s towns. Couple families make up 60% of households and one-parent families 4.9%. Schools near Seguin are on its Schools page.
What is the median income in Seguin?
Median total household income in Seguin was $84,000 in 2020, against a median of $86,000 across Canada’s towns.
What is the population of Seguin?
The latest figure is an estimate: 5,761 residents in July 2025. At the 2021 Census, Seguin counted 5,280, 23% more than 2016.
What is the average age in Seguin?
Half the residents are older than 54.8 and half younger, older than 95% of Canadian towns; 11% are children under 15 and 29% are 65 or over.
Is Seguin bilingual?
Across Canada’s towns a typical 7.5% are bilingual; here 4% are. Another 0% speak only French and 96% only English, and French is the first language of 1%.
How diverse is Seguin?
Across Canada’s towns a typical 17% are immigrants; here, 8.4%. A visible minority makes up 1.7% and Indigenous residents 4.5%.
Sources: Statistics Canada, Census Profile, 2021 Census of Population · Statistics Canada, population estimates for 1 July 2025 (table 17-10-0155). Under the Statistics Canada Open Licence.
Adapted from Statistics Canada (Census of Population 2021, population estimates 2025, 2021 census boundaries) under the Statistics Canada Open Licence; this does not constitute an endorsement by Statistics Canada. Neighbourhood names in some cities © OpenStreetMap contributors (ODbL).