
Pictonin Prince Edward County, Ontario
Some 27,544 people live in this town, in Ontario. It is part of Prince Edward, a census division.
Is Picton a good place to live?
Real strengths, and real weak spots. Housing is expensive (D). Police record less crime here than in most towns (A). Overall, that makes a C, good for #688 of 858 in Ontario. It comes out better than 30% of Canadian towns. The rest of its grades are middling: C+ for schools, C+ for jobs & income and B for walkability.
Health is graded on the health region's survey figures and life expectancy, with the distance to hospital giving the town its own spread.
What makes Picton stand out
The 3 things Picton does most differently from other towns.
How Picton grades
Each subject compares Picton with Canadian towns of 2,500 or more, ordered by how far it is from the middle. Towns in other countries are graded separately.
How TownRatings grades Canadian towns →
ANDARA Gallery and 19 more in and around Picton
From museums to parks and historic sites: Picton’s places to visit and those just beyond its edge, most famous first.
The data
Data highlights are ordered by what stands out in Picton.
Picton’s Violent Crime Severity Index, 51, runs below Ontario’s towns and Canadian towns
Thefts, break-ins and damage came to 12.4 per 1,000 residents a year, below Ontario’s towns (30.5) and Canadian towns (31.2) alike. Violent crime runs at 9.7 per 1,000 residents a year.
Year by year · Crime Severity Index for each year
| 2023–2025 | Picton | Ontario | Canada |
|---|---|---|---|
| Property crime per 1,000 | 12.4 | 30.5 | 31.2 |
| Violent Crime Severity Index | 51 | 76 | 86 |
Statistics Canada, Uniform Crime Reporting Survey, 2023–2025 average
Measured against local pay, Picton costs more to live in than 89% of Canadian towns
17% of households spent 30% or more of their income on shelter, lower than both Ontario’s towns (22%) and Canadian towns (18%). Households that own their home make up 82%.
What homes were worth · The median owner’s estimate at the 2021 census
| Census 2021 | Picton | Ontario | Canada |
|---|---|---|---|
| Households spending 30%+ on shelter | 17% | 22% | 18% |
| Households owning their home | 82% | 76% | 74% |
Statistics Canada, Census 2021; CMHC Rental Market Survey via Statistics Canada · Values come from owners at the 2021 census and incomes from 2020, so they predate the later rise in rates.
Picton’s health region counts 18% of adults who smoke, above the typical Canadian town’s 12%
In the health survey, 45% of adults in the region rated their health very good or excellent, below Ontario’s towns (51%) and Canadian towns (52%) alike. Women in the region live to 81.8 and men to 77.8, 79.8 years taken together (2022/2024). For Picton itself the measure is access, and it lags: 8.2 km to the nearest hospital, where 3.7 km is typical.
Very good or excellent health · adults, age-standardised
| Health | Picton | Ontario | Canada |
|---|---|---|---|
| Smokers | 18% | 10% | 12% |
| Chronic conditions (average share) | 20% | 17% | 17% |
| Very good or excellent health | 45% | 51% | 52% |
| Life expectancy at birth | 79.8 | 82.8 | 81.5 |
Statistics Canada, Canadian Community Health Survey 2023/2024 and life expectancy 2022/2024; Open Database of Healthcare Facilities · Health survey and life expectancy published for the Hastings and Prince Edward Counties Health Unit, not by town
Picton is on Canada’s flood inventory: 2 listed, led by Quinte Conservation Authority
More homes than usual carry radon here, 12% over the guideline where the typical town has 6.6%. Earthquake risk in Picton is ordinary: NRCan’s model puts building losses at $0.040 a year per $1,000 of value, close to the typical town’s $0.030.
Radon tests above the guideline · share of tested homes, 200 Bq/m³
| Hazards | Picton | Ontario | Canada |
|---|---|---|---|
| Radon tests above the guideline | 12% | 4% | 6.6% |
| Earthquake loss per $1,000 of buildings a year | $0.040 | $0.043 | $0.030 |
NRCan seismic risk model and burned areas, Health Canada radon survey, the Flood Hazard Map Inventory
Fewer of Picton’s people belong to a visible minority than in Ontario’s towns or Canadian towns: 3.1%
Immigrants make up 10% of residents, above both Ontario’s towns (7.6%) and Canadian towns (6.4%). 3.2% of residents have an Indigenous identity, above both Ontario’s towns (1.6%) and Canadian towns (2.8%).
Ages · Share of residents in each age group, Census 2021
Schooling · Highest qualification, residents 15 and over
Women and men · all residents
Women make up 51.4% of Picton
Women numbered 13,220 and men 12,480 in 2021, next to a 50.9% share of women for Canada.
| Picton | Ontario | Canada | |
|---|---|---|---|
| Under 15 | 12% | 15% | 16% |
| 15 to 64 | 55% | 65% | 64% |
| 65+ | 34% | 19% | 19% |
| No certificate, diploma or degree | 14% | 15% | 16% |
| Postsecondary qualification | 57% | 56% | 56% |
Statistics Canada, Census 2021; Ontario and Canada: medians of towns of 2,500+
Making a living in Picton
The average trip to work took 25 min, lower than Ontario’s towns (29 min) and near Canadian towns (26 min). 91% of commuters took the car to work at the census.
How working residents got to work · census 2021
| Census 2021 | Picton | Ontario | Canada |
|---|---|---|---|
| Average trip | 25 min | 29 min | 26 min |
| Car or van | 91% | 88% | 89% |
Statistics Canada, Census 2021 (labour and commuting) · Counted in May 2021, under pandemic rules: fewer commutes and more people between jobs than in a normal year.
Picton’s schools mostly sit under the middle in Ontario, 12 of the 21 with results
Boards running schools in the area: 2, below Ontario’s towns (4) and Canadian towns (3) alike. No French-language school is among them; in Ontario, 10% of schools are. In or within 3 km of Picton: 19 elementary schools, 4 secondary schools and 4 alternative or adult schools, with 8,310 students.
| School | Level | Students | System |
|---|---|---|---|
| Prince Edward Collegiate Institute Elementary School Fourth fifth in OntarioLargest elementary schoolElementary · Grades JK–8 | Elementary · Grades JK–8 | 615 | English public |
| Centennial Secondary School Fourth fifth in OntarioLargest secondary schoolSecondary · Grades 9–12 | Secondary · Grades 9–12 | 930 | English public |
Schools by system · Schools within 3 km
| Schools within 3 km | Picton | Ontario | Canada |
|---|---|---|---|
| School boards | 2 | 4 | 3 |
| Nearest elementary school | 9.2 km | 0.5 km | 0.5 km |
| Nearest secondary school | 9.8 km | 1.2 km | 1.2 km |
Provincial school lists and results, 2024-25
January nights in Picton drop to −11.2°C (Ontario towns −9.1°C, Canadian towns −13.5°C)
A normal September brings 92 mm of precipitation, more than any other month. Gardeners get 161 frost-free days, from 1 May to 10 October. The warmest stretch brings July afternoons of 26.5°C, close to Ontario’s towns (26.7°C) and above Canadian towns (25.5°C). Snow peaks in January: 44 cm in a normal year.
Average high by season · ECCC normals, 1991–2020
| Normals, 1991–2020 | Picton | Ontario | Canada |
|---|---|---|---|
| January night low | −11.2°C | −9.1°C | −13.5°C |
| July afternoon high | 26.5°C | 26.7°C | 25.5°C |
| Days with frost a year | 146 | 139 | 159 |
| Snowfall a year | 155 cm | 146 cm | 141 cm |
Environment and Climate Change Canada, Canadian Climate Normals 1991–2020 (Trenton)
A normal November in Picton runs from −2°C to 7°C
November normally sees 84 mm of precipitation. July brings the warmest days, 27°C; January the coldest nights, −11°C. ECCC’s forecast for Prince Edward (Picton) is on the Weather page, hour by hour.
Normal highs, the months ahead · ECCC normals, 1991–2020
| Season | High | Low | Rain and snow |
|---|---|---|---|
| Winter | 0°C | −10°C | 215 mm |
| Spring | 12°C | 1°C | 230 mm |
| Summer | 25°C | 14°C | 228 mm |
| Autumn | 14°C | 4°C | 267 mm |
ECCC normals, 1991–2020 (Trenton); the forecast is on the Weather page
Chris Malette (Liberal Party of Canada) represents Picton in Ottawa as MP for Bay of Quinte
Locally, Picton is governed as part of Prince Edward County, a city.
| Turnout | Picton | Ontario | Canada |
|---|---|---|---|
| Municipal election, 2022 | 47% | 31% | 31% |
Wikidata, MAMH, MMAH, Statistics Canada
6 public library branches serve Picton
Prince Edward County Public Library counts 25,704 people in its service area.
Provincial library statistics, OpenStreetMap, the CRA and Statistics Canada
The boundary of Thousand Islands National Park runs along Picton
Within 10 km, the count of public protected areas is 10, above both Ontario’s towns (4) and Canadian towns (4). Out to 10 km from the town’s edge, 1.5% of the land is protected; 2.3% is typical for a Canadian town. The Woodlands Trail is the one mapped walking route close by.
Protected land · of the land within 10 km
| Outdoors | Picton | Ontario | Canada |
|---|---|---|---|
| Public protected areas within 10 km | 10 | 4 | 4 |
| Protected land within 10 km | 1.5% | 2.3% | 2.3% |
Canadian Protected and Conserved Areas Database (CPCAD), OpenStreetMap routes and beaches
Picton’s oldest designated place, Carrying Place of the Bay of Quinte, dates from 1787
The list takes in a heritage lighthouse. The registers put 2 historic places inside its boundary, one of them of the highest rank. Homes from before 1961 make up 35% of the stock, above both Ontario’s towns (22%) and Canadian towns (18%). One more stands just outside, within 5 km of the town’s edge.
Historic places by designation · inside the town
Among them
| Heritage | Picton | Ontario | Canada |
|---|---|---|---|
| Homes built before 1961 | 35% | 22% | 18% |
Canadian Register of Historic Places, Directory of Federal Heritage Designations, Québec’s Répertoire du patrimoine culturel, Wikidata; Census 2021 homes by period
Everything we know about Picton
Famous people from Picton
41 notable people were born in Picton.


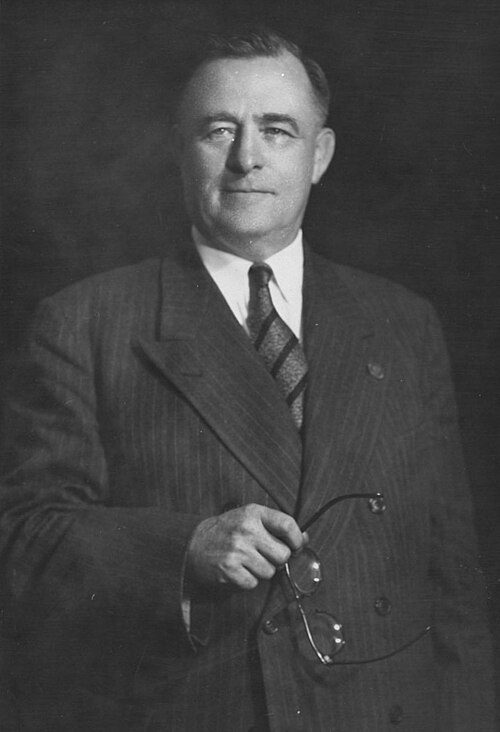
Photo credits
Gena Branscombe: The Year book of Canadian art. 1912/13., Public domain · Casey Albert Wood: Unknown author, Public domain · Rodmond Roblin: John Alexander Cooper (b. 1868), Public domain · Charles P. Gruppé: Unknown author, Public domain · Herbert Charles Wilson: Unknown author, Public domain · Ralph Campney: Arthur Roy, Public domain
Picton’s neighbours
The nearest places of 1,000 or more. Statistics Canada
| Town | People | km | Overall | Cost | Safety | Health |
|---|---|---|---|---|---|---|
| Picton | 27,544 | — | C | D | A | C− |
| Tyendinaga Mohawk Territory | 3,028 | 18 | — | — | — | D |
People: Statistics Canada, Census 2021. Distances: centre to centre.
Questions about Picton
Who are the people of Picton?
At the 2021 census, 10% were immigrants and 3% belonged to a visible minority (Canadian towns’ median: 15%). 3% identify as First Nations, Métis or Inuit.
Is Picton a young town or an old one?
Its median age is 56.8, where Canadian towns sit at 45.2. Under-15s are 12% of residents; over-65s, 34%.
What kind of homes are in Picton?
Mostly 86% single-detached houses (the median of Canadian towns: 64%), with 0% of homes in buildings of five or more storeys. Households hold 2.2 people on average, and 27% have just one.
Is Picton growing?
Yes: the census counted 24,735 in 2016 and 25,704 in 2021, a rise of 3.9%, against 4.1% for the median of Canadian towns. The 2025 estimate is 27,544.
About Picton
Town in Ontario
Statistics Canada treats Picton as a single census subdivision in Ontario, and TownRatings keeps to that line.
Statistics Canada: population estimates 2025 (17-10-0155), Census of Population 2021, 2021 census boundaries.
- Population
- 27,544 (people, 2025 estimate)
- Province or territory
- Ontario
- Census division
- Prince Edward
- Census subdivision
- 3513020
Sources: Statistics Canada, Census of Population 2021 · population estimates 2025 (17-10-0155) and 2021 census boundaries · Uniform Crime Reporting Survey 2023–25 (35-10-0026, 35-10-0183 to 35-10-0190) · CMHC rents as published by Statistics Canada (34-10-0133) · grades by TownRatings. Under the Statistics Canada Open Licence.
Adapted from Statistics Canada (Census of Population 2021, population estimates 2025, 2021 census boundaries) under the Statistics Canada Open Licence; this does not constitute an endorsement by Statistics Canada. Neighbourhood names in some cities © OpenStreetMap contributors (ODbL).