
OshawaOntario
Between 2016 and 2021, its population grew by 10%. Home to 213,592 people, this town lies in Ontario.
Is Oshawa a good place to live?
Some subjects shine; others lag. Prices are high against local incomes (D−). Walkability is its strong suit (A). All told, that adds up to a B− overall, better than 45% of Canadian towns. That places it #565 of 858 in Ontario. It lags on jobs & income as well (D).
Rents here are the metro area's average, shared by every town and neighbourhood in it. Safety is the regional police service's figure, shared with its other towns. Health is graded on the health region's survey figures and life expectancy, with the distance to hospital giving the town its own spread.
What makes Oshawa stand out
The 3 things Oshawa does most differently from other towns.
How Oshawa grades
Each subject compares Oshawa with Canadian towns of 2,500 or more, ordered by how far it is from the middle. Towns in other countries are graded separately.
How TownRatings grades Canadian towns →
Oshawa Community Museum and 11 more in and around Oshawa
The best-known places to visit in and around Oshawa come first; the full list is on the Attractions page.
 Art galleryThe Robert McLaughlin Galleryin town
 MuseumOntario Regiment Museumin town
 MuseumOshawa Military and Industrial Museumin town
 MuseumParkwoodin townMuseumMuseumCanadian Automotive Museumin town
Photos: each place’s Wikidata image, from Wikimedia Commons under the licence below (our copy, resized).
Photo credits (4)
- The Robert McLaughlin Gallery: Hyfen, CC BY-SA 3.0, Wikimedia Commons
- Ontario Regiment Museum: Public domain, Wikimedia Commons
- Oshawa Military and Industrial Museum: Public domain, Wikimedia Commons
- Parkwood: Robert AD Scott, Public domain, Wikimedia Commons
The data
Data highlights are ordered by what stands out in Oshawa.
Home ownership in Oshawa, 64%, runs below Ontario’s towns and Canadian towns
Rent as a share of income and monthly rent for a two-bedroom for the Oshawa metro area
A year’s rent came to 25% of the median household income, higher than both Ontario’s towns (22%) and Canadian towns (20%). 28% of households spent 30% or more of their income on shelter, above both Ontario’s towns (22%) and Canadian towns (18%).
What homes were worth · The median owner’s estimate at the 2021 census
| Census 2021 | Oshawa | Ontario | Canada |
|---|---|---|---|
| Households spending 30%+ on shelter | 28% | 22% | 18% |
| Rent as a share of income | 25% | 22% | 20% |
| Households owning their home | 64% | 76% | 74% |
Statistics Canada, Census 2021; CMHC Rental Market Survey via Statistics Canada · These are 2021 census values, as owners judged them, set against household income in 2020.
Oshawa faces fewer hazards than 89% of Canadian towns
3 flood studies cover the town, the latest by Town of Whitby. For earthquakes Oshawa is middling, $0.033 a year per $1,000 against $0.030 for the typical town.
Radon tests above the guideline · share of tested homes, 200 Bq/m³
| Hazards | Oshawa | Ontario | Canada |
|---|---|---|---|
| Radon tests above the guideline | 0% | 4% | 6.6% |
| Earthquake loss per $1,000 of buildings a year | $0.033 | $0.043 | $0.030 |
NRCan seismic risk model and burned areas, Health Canada radon survey, the Flood Hazard Map Inventory
Trips to work from Oshawa take longer than from Ontario’s towns or Canadian towns: 32 min on average
88% of commuters drove, near both Ontario’s towns (88%) and Canadian towns (89%).
How working residents got to work · census 2021
| Census 2021 | Oshawa | Ontario | Canada |
|---|---|---|---|
| Average trip | 32 min | 29 min | 26 min |
| Car or van | 88% | 88% | 89% |
Statistics Canada, Census 2021 (labour and commuting) · These are May 2021 figures, gathered while COVID-19 kept many people home or out of work.
Oshawa’s grade for safety: an A−
The Crime Severity Index, Violent Crime Severity Index, violent crime and property crime per 1,000 numbers here cover the Durham Region (Oshawa/Whitby/Ajax) service area
The index for the force that serves it came to 46, below Ontario’s towns (56) and Canadian towns (67) alike. Violent crime in the area its police cover: 7.9 per 1,000 people a year. For every 1,000 residents of its police area, 20.4 property crimes are reported each year.
Year by year · Crime Severity Index for each year
| 2023–2025 | Oshawa | Ontario | Canada |
|---|---|---|---|
| Property crime per 1,000 | 20.4 | 30.5 | 31.2 |
| Crime Severity Index | 46 | 56 | 67 |
| Violent crime | 7.9 | 10.5 | 12 |
| Violent Crime Severity Index | 61 | 76 | 86 |
Statistics Canada, Uniform Crime Reporting Survey, 2023–2025 average
Very good or excellent health for 50% of adults in Oshawa’s health region
Lives here run to 82.6 years on average, about level with Ontario’s towns (82.8) and above Canadian towns (81.5). What sets Oshawa apart within its region is distance, and at 2.9 km to a hospital it is ordinary (3.7 km typical). For everyday care, the nearest pharmacy is 0.9 km away on average (9.8 within 3 km).
Very good or excellent health · adults, age-standardised
| Health | Oshawa | Ontario | Canada |
|---|---|---|---|
| Chronic conditions (average share) | 19% | 17% | 17% |
| Very good or excellent health | 50% | 51% | 52% |
| Life expectancy at birth | 82.6 | 82.8 | 81.5 |
| Smokers | 11% | 10% | 12% |
Statistics Canada, Canadian Community Health Survey 2023/2024 and life expectancy 2022/2024; Open Database of Healthcare Facilities · Not measured by town: health survey and life expectancy (the Durham Regional Health Unit)
Ice rarely forms: Oshawa sees fewer frosts than 84% of Canadian towns
January is the snowiest month, with 34 cm on average. Gardeners get 167 frost-free days, from 30 April to 15 October. The coldest nights, in January, bottom out at −8.9°C, near Ontario’s towns (−9.1°C) and higher than Canadian towns (−13.5°C). June is the wettest month, with 94 mm of rain and snow on average.
Average high by season · ECCC normals, 1991–2020
| Normals, 1991–2020 | Oshawa | Ontario | Canada |
|---|---|---|---|
| Snowfall a year | 102 cm | 146 cm | 141 cm |
| Days with frost a year | 130 | 139 | 159 |
| January night low | −8.9°C | −9.1°C | −13.5°C |
| July afternoon high | 25.7°C | 26.7°C | 25.5°C |
Environment and Climate Change Canada, Canadian Climate Normals 1991–2020 (Oshawa)
Children make up 18% of Oshawa, above Ontario’s towns and Canadian towns
Visible minorities make up 29% of the population, higher than both Ontario’s towns (26%) and Canadian towns (15%). Retirement age and beyond: 17% of residents are 65 or older.
Ages · Share of residents in each age group, Census 2021
Schooling · Highest qualification, residents 15 and over
Women and men · all residents
51.0% of Oshawa’s residents are women
In 2021 there were 89,400 women to 85,980 men; Canada as a whole is 50.9% women.
| Oshawa | Ontario | Canada | |
|---|---|---|---|
| Under 15 | 18% | 15% | 16% |
| 15 to 64 | 66% | 65% | 64% |
| 65+ | 17% | 19% | 19% |
| No certificate, diploma or degree | 17% | 15% | 16% |
| Postsecondary qualification | 51% | 56% | 56% |
Statistics Canada, Census 2021; Ontario and Canada: medians of towns of 2,500+
What November brings in Oshawa: freezing at night, 8°C by day
ECCC’s forecast for Oshawa is on the Weather page, hour by hour. Precipitation in November averages 73 mm. The month after, December, normally sees 2°C afternoons and −5°C nights. At the extremes, July afternoons reach 26°C and January nights −9°C.
Normal highs, the months ahead · ECCC normals, 1991–2020
| Season | High | Low | Rain and snow |
|---|---|---|---|
| Winter | 0°C | −7°C | 196 mm |
| Spring | 11°C | 2°C | 226 mm |
| Summer | 24°C | 15°C | 254 mm |
| Autumn | 14°C | 6°C | 231 mm |
ECCC normals, 1991–2020 (Oshawa); the forecast is on the Weather page
19,420 residents per council seat in Oshawa, a higher ratio than 96% of Ontario municipalities
Voters in Oshawa chose Dan Carter as mayor in October 2022, for a 11-seat council.
| Turnout | Oshawa | Ontario | Canada |
|---|---|---|---|
| Municipal election, 2022 | 18% | 31% | 31% |
Wikidata, MAMH, MMAH, Statistics Canada
Oshawa has 5 public library branches
Oshawa Public Libraries counts 186,375 people in its service area.
Provincial library statistics, OpenStreetMap, the CRA and Statistics Canada
Rouge National Urban Park lies 17 km beyond Oshawa’s edge
Within 10 km, the count of public protected areas is 13, above Ontario’s towns (4) and Canadian towns (4) alike. One mapped walking route passes within 2 km: the Oak Ridges Trail.
Protected land · of the land within 10 km
| Outdoors | Oshawa | Ontario | Canada |
|---|---|---|---|
| Public protected areas within 10 km | 13 | 4 | 4 |
| Protected land within 10 km | 2.4% | 2.3% | 2.3% |
Canadian Protected and Conserved Areas Database (CPCAD), OpenStreetMap routes and beaches
6 school boards overlap in Oshawa, covering Ontario’s four systems
On the tests, 20 of 87 schools land above the middle in Ontario, 42 under it. Maxwell Heights Secondary School is the biggest, at 1,765 students. Of the 93, 3 teach in French (10% of schools in Ontario). Within 3 km of Oshawa are 77 elementary schools, 14 secondary schools and 2 alternative or adult schools, teaching 50,695 students.
| School | Level | Students | System |
|---|---|---|---|
| Dr G J MacGillivray Public School Middle fifth in OntarioLargest elementary schoolElementary · Grades JK–6 | Elementary · Grades JK–6 | 880 | English public |
| Maxwell Heights Secondary School Middle fifth in OntarioLargest secondary schoolSecondary · Grades 9–12 | Secondary · Grades 9–12 | 1,765 | English public |
| ÉÉC Corpus-Christi FrenchTeaches in FrenchElementary · Grades JK–6 | Elementary · Grades JK–6 | 305 | French Catholic |
| St. Mother Teresa Catholic Elementary School CatholicResults in the top fifth in OntarioElementary · Grades JK–8 | Elementary · Grades JK–8 | 400 | English Catholic |
Schools by system · Schools within 3 km
| Schools within 3 km | Oshawa | Ontario | Canada |
|---|---|---|---|
| School boards | 6 | 4 | 3 |
Provincial school lists and results, 2024-25
Heritage in Oshawa: 2 historic places, one of the highest rank
The list takes in a Recognized Federal Heritage Building. Its oldest building on the record is Colonel R. S. McLaughlin Armoury, from 1914. 24% of its homes were built before 1961, above both Ontario’s towns (22%) and Canadian towns (18%).
Historic places by designation · inside the town
Among them
- Parkwood 1915
- Colonel R. S. McLaughlin Armoury 1914
| Heritage | Oshawa | Ontario | Canada |
|---|---|---|---|
| Homes built before 1961 | 24% | 22% | 18% |
Canadian Register of Historic Places, Directory of Federal Heritage Designations, Québec’s Répertoire du patrimoine culturel, Wikidata; Census 2021 homes by period
Everything we know about Oshawa
Famous people from Oshawa
151 notable people were born in Oshawa.


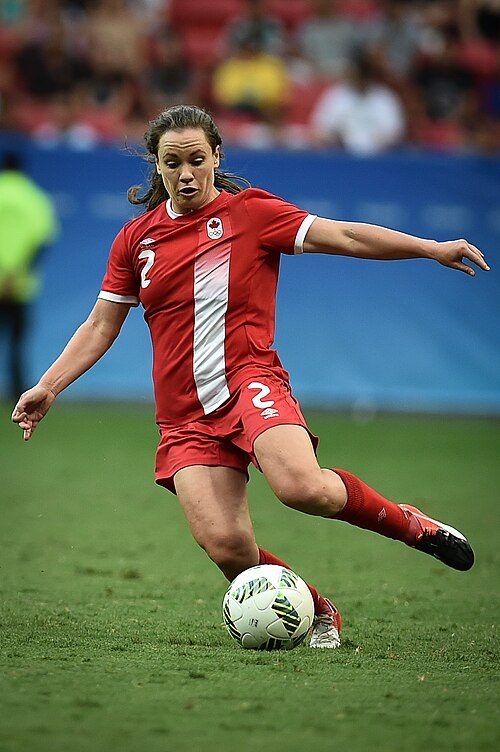

Photo credits
A. J. Cook: Nigel Horsley, CC BY-SA 2.0 · Shalom Harlow: David Shankbone, CC BY-SA 3.0 · Perdita Felicien: Perdita_Felicien_TK.jpg : Damien D. derivative work: Tabercil, CC BY-SA 2.0 · Joe Nieuwendyk: Resolute, CC BY 3.0 · Allysha Chapman: Agência Brasília, CC BY 2.0 · Lennon Stella: Justin Higuchi from Los Angeles, CA, USA, CC BY 2.0
Oshawa’s neighbours
The nearest places of 1,000 or more. Statistics Canada
| Town | People | km | Overall | Cost | Safety | Health |
|---|---|---|---|---|---|---|
| Oshawa | 213,592 | — | B− | D− | A− | B+ |
| Whitby | 162,413 | 7.1 | B+ | C | A− | B |
| Bowmanville | 114,180 | 13 | B− | C− | A− | B |
| Ajax | 141,111 | 15 | B+ | D | A− | B |
People: Statistics Canada, Census 2021. Distances: centre to centre.
Questions about Oshawa
Has Oshawa grown?
It added people: 159,458 in 2016, 175,383 in 2021, 10% more, where the middle of Canadian towns grew 4.1%. Statistics Canada’s 2025 estimate is 213,592.
How old are the people of Oshawa?
The median resident is 39.2 years old, against 45.2 for the median of Canadian towns. 18% are under 15 and 17% are 65 or over.
About Oshawa
Town in Ontario
TownRatings follows Statistics Canada’s map: Oshawa is one municipality in Ontario, figures and all.
Statistics Canada: population estimates 2025 (17-10-0155), Census of Population 2021, 2021 census boundaries.
- Population
- 213,592 (people, 2025 estimate)
- Province or territory
- Ontario
- Census division
- Durham
- Census subdivision
- 3518013
Sources: Statistics Canada, Census of Population 2021 · population estimates 2025 (17-10-0155) and 2021 census boundaries · Uniform Crime Reporting Survey 2023–25 (35-10-0026, 35-10-0183 to 35-10-0190) · CMHC rents as published by Statistics Canada (34-10-0133) · grades by TownRatings. Under the Statistics Canada Open Licence.
Adapted from Statistics Canada (Census of Population 2021, population estimates 2025, 2021 census boundaries) under the Statistics Canada Open Licence; this does not constitute an endorsement by Statistics Canada. Neighbourhood names in some cities © OpenStreetMap contributors (ODbL).