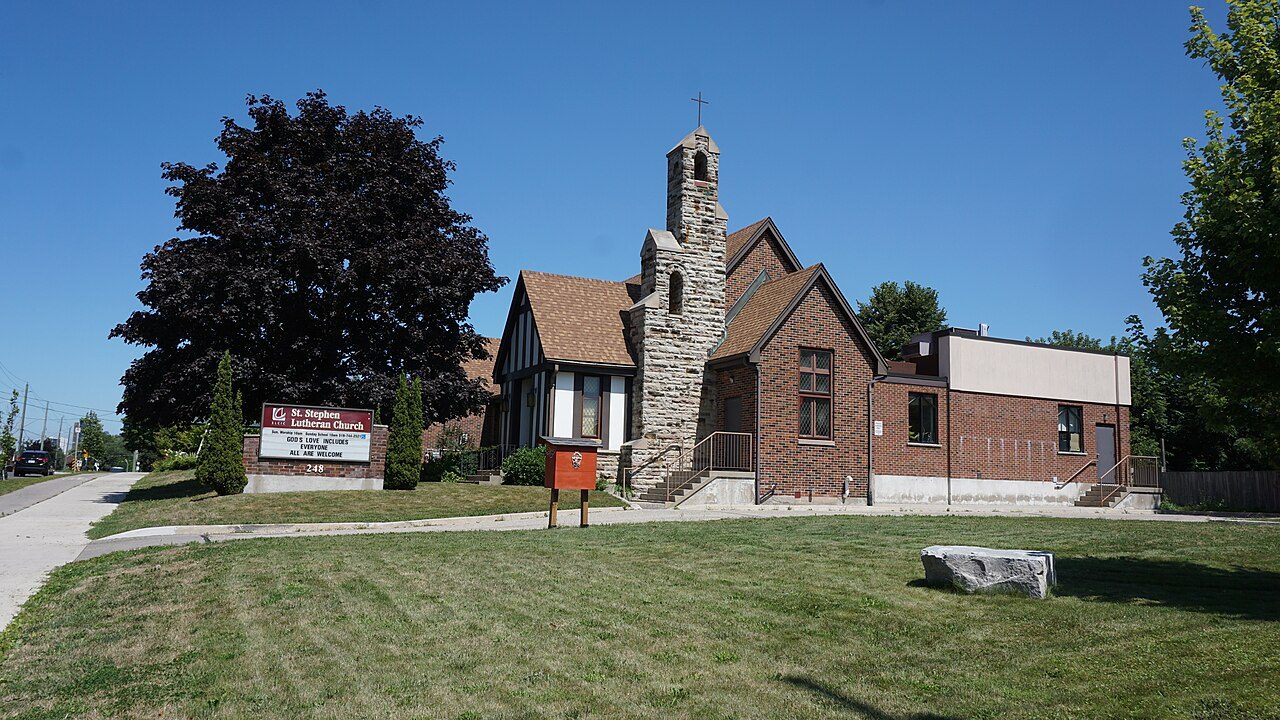
 Photo: JFVoll · CC BY-SA 3.0
Per resident, Southdale records about as much crime as the typical place among Canadian towns
Annual rates stand at 14.2 violent incidents and 32.2 incidents of property crime for every thousand residents, next to 10.8 and 25.1 in the typical Canadian town of 50,000+. Even so, the index fell from 75.8 in 2023 to 66.8 in 2025. Southdale grades C+ for safety overall (#680 of 862 in Ontario): close to the middle of Canadian towns, on crime its police reported from 2023 to 2025. Its violent half comes to 89.7 and its non-violent half to 65.4, where the norm is 75.2 and 54.2.
Statistics Canada, police-reported crime, 2023–2025 means. The index weighs each crime by its seriousness; rates are incidents per 1,000 residents a year. Crime severity and crime rate published for the Waterloo Region (Kitchener) service area, not by town.
Southdale: C+ for safety, and why
How sure: Less sure than most, because no figure exists for Southdale on its own; the city’s, for its whole area, stands in.
The grade weighs the Crime Severity Index and its violent half, averaged over 2023–2025, against every Canadian town and city neighbourhood of 1,000 people or more.
Its place: #680 of 862 in Ontario and #1,466 of 2,572 Canadian towns.
The Crime Severity Index and its two halves, beside the typical figure for Canadian towns of 50,000 people or more.
Southdale, year by year
Crime Severity Index
The index started at its highest, 75.8 in 2023, and touched its lowest in 2025, at 66.8. The comparison line, the typical Canadian town of 50,000+, runs from 64.3 in 2023 to 59.2 by 2025.
Every year as a table
| Year | Southdale | Typical town of 50,000+ |
|---|---|---|
| 2025 | 66.8 | 59.2 |
| 2024 | 73.1 | 59.9 |
| 2023 | 75.8 | 64.3 |
Statistics Canada, Crime Severity Index by police service, each year as published. Typical: the median of Canadian towns of 50,000 people or more.
The Crime Severity Index of the police covering Southdale, each year, against the typical Canadian town of 50,000+.
Crime across Waterloo Region (Kitchener), by type
These are Waterloo Region (Kitchener)’s figures, for its police’s whole area: they aren’t published by neighbourhood.
Against the typical town its size, Waterloo Region (Kitchener) runs highest on assault (7.7 per 1,000 against 4.9), fraud (7.6 per 1,000 against 5) and break and enter (3 per 1,000 against 2.2).
Every Statistics Canada violation line
| Violation | Incidents a year | Per 1,000 | Cleared |
|---|---|---|---|
| Homicide | 4.7 | 0.01 | — |
| Sexual violations against children | 227.7 | 0.3 | 39% |
| Assaults against a peace officer | 143.3 | 0.2 | 98% |
| Firearms: use, discharge, pointing | 69 | 0.10 | 52% |
| Robbery | 362.3 | 0.5 | 50% |
| Forcible confinement or kidnapping | 120.3 | 0.2 | 69% |
| Other violent violations | 165.7 | 0.2 | 40% |
| Breaking and entering | 2,068.3 | 3 | 22% |
| Possession of stolen property | 715 | 1 | 30% |
| Theft of a motor vehicle | 1,197 | 1.7 | 13% |
| Theft over $5,000 | 290.7 | 0.4 | 11% |
| Theft under $5,000 | 9,915.7 | 14.2 | 18% |
| Mischief | 2,902.3 | 4.2 | 21% |
| Weapons violations | 339 | 0.5 | 53% |
| Administration of justice violations | 3,165.7 | 4.5 | 90% |
| Other Criminal Code violations | 741.7 | 1.1 | 32% |
| Drug violations | 374.7 | 0.5 | 90% |
| Impaired driving | 414.7 | 0.6 | 94% |
| Failing to stop or remain | 67.7 | 0.10 | 74% |
Statistics Canada’s violation groups for the whole police service or detachment: incidents a year are its own, the town’s share is only estimated in the tiles. Cleared: incidents solved by a charge or otherwise, as a share of those reported.
Incidents per 1,000 residents a year, 2023–2025 means, against the typical figure for Canadian towns of 50,000 people or more.
Crime in the places around Southdale
| Town | People | Severity index | Violent index | Safety |
|---|---|---|---|---|
| Southdale | 5,277 | 71.9 | 89.7 | C+ |
| Mill Courtland Woodside Park | 3,319 | 71.9 | 89.7 | C+ |
| Cedar Hill | 3,190 | 71.9 | 89.7 | C+ |
| Meinzinger Park-Lakeside | 5,007 | 71.9 | 89.7 | C+ |
| Alpine | 3,055 | 71.9 | 89.7 | C+ |
| Victoria Park | 3,574 | 71.9 | 89.7 | C+ |
| Laurentian Hills | 10,026 | 71.9 | 89.7 | C+ |
Where neighbours share its police, they share the figure too: 6 aren’t counted above.
Each place’s police figures, 2023–2025 means.
What this data can and can’t tell you
- The clearance rate. Weighted like the index, so solving one assault counts for more than solving a mischief; a charge laid, recommended or otherwise resolved all count.
- Severity, weighed. The index weighs crimes rather than counting them: a serious offence moves it far more than a minor one. Statistics Canada is plain about its limits: “The CSI is not an indicator of overall safety and should be interpreted in the broader community context.”
- Not the neighbourhood’s own. The figures for Southdale are city-wide: neighbourhood counts aren’t published as open data here.
- What 100 means. Its scale starts from Canada in 2006, set at 100, so a figure above 100 means more serious crime per resident than the country had then.
Questions about safety in Southdale
Is Southdale safe?
Southdale measures 71.9 on the Crime Severity Index for 2023–2025, next to 60.3 for Canadian towns of 50,000 people or more. Per 1,000 residents a year, its police record 14.2 violent incidents and 32.2 property crimes.
What is the most common crime in Southdale?
Police record theft under $5,000 most, 14.2 per 1,000 residents a year, ahead of assault (7.7) and fraud (7.6).
Is crime going up in Southdale?
Over 2023–2025 the index dropped 12%, to 66.8 from 75.8.
How much of Southdale’s crime do police solve?
32%, by the weighted clearance rate, where the typical Canadian town of 50,000+ manages 38%. Violent crime is cleared at 45% and non-violent crime at 25%.
Whose figures are these?
Those of the police service that covers the whole city.
Source: Statistics Canada, police-reported crime by police service and detachment, 2023–2025 (Statistics Canada Open Licence); TownRatings calculation.
Sources: Statistics Canada, Crime severity index and weighted clearance rates, police services (tables 35-10-0186 to 0190, 0061, 0063, 0064), 2023–2025 · Statistics Canada, Incident-based crime statistics by detailed violations, police services (35-10-0178 to 0185) · Safety Grade: TownRatings calculation. Under the Statistics Canada Open Licence.
Adapted from Statistics Canada (Census of Population 2021, population estimates 2025, 2021 census boundaries) under the Statistics Canada Open Licence; this does not constitute an endorsement by Statistics Canada. Neighbourhood names in some cities © OpenStreetMap contributors (ODbL).