
CollingwoodOntario
Its population rose 14% from 2016 to 2021. Population 28,366: a town in Ontario.
Is Collingwood a good place to live?
Getting around on foot or by bus is easy (A−). People here tend to be in good health (A−). The catch is cost of living (D−). Put together, the subjects come to a B overall, better than 63% of Canadian towns. Its place in the ranking is #335 of 858 in Ontario. Its other grades sit near the middle: B for safety and B for jobs & income.
Health is graded on the health region's survey figures and life expectancy, with the distance to hospital giving the town its own spread.
What makes Collingwood stand out
The 3 things Collingwood does most differently from other towns.
How Collingwood grades
Each subject compares Collingwood with Canadian towns of 2,500 or more, ordered by how far it is from the middle. Towns in other countries are graded separately.
How TownRatings grades Canadian towns →
The data
Data highlights are ordered by what stands out in Collingwood.
Collingwood earns an A+ for hazard risk
0.9% of radon tests in the survey area came in above the guideline, below Ontario’s towns (4%) and Canadian towns (6.6%) alike. For earthquakes Collingwood is middling, $0.016 a year per $1,000 against $0.030 for the typical town. The national flood inventory has no study of the town.
Radon tests above the guideline · share of tested homes, 200 Bq/m³
| Hazards | Collingwood | Ontario | Canada |
|---|---|---|---|
| Radon tests above the guideline | 0.9% | 4% | 6.6% |
| Earthquake loss per $1,000 of buildings a year | $0.016 | $0.043 | $0.030 |
NRCan seismic risk model and burned areas, Health Canada radon survey, the Flood Hazard Map Inventory
Renting in Collingwood eats 24% of household income, more than in Ontario’s towns or Canadian towns
27% of households spent 30% or more of their income on shelter, higher than both Ontario’s towns (22%) and Canadian towns (18%). Home ownership covers 73% of households.
What homes were worth · The median owner’s estimate at the 2021 census
| Census 2021 | Collingwood | Ontario | Canada |
|---|---|---|---|
| Households spending 30%+ on shelter | 27% | 22% | 18% |
| Rent as a share of income | 24% | 22% | 20% |
| Households owning their home | 73% | 76% | 74% |
Statistics Canada, Census 2021; CMHC Rental Market Survey via Statistics Canada · These are 2021 census values, as owners judged them, set against household income in 2020. · Rent as a share of income and monthly rent for a two-bedroom published for the Collingwood metro area, not by town
54% of adults around Collingwood rate their health very good or excellent
Area-wide: health survey and life expectancy, counted over the Simcoe Muskoka District Health Unit
Measured from where Collingwood’s residents live, the nearest hospital is 2.3 km away, under the typical 3.7 km. Women in the region live to 83.5 and men to 79.5, 81.5 years taken together (2022/2024). A pharmacy is nearer: 1.7 km on average, with 2.6 within 3 km of the typical home.
Very good or excellent health · adults, age-standardised
| Health | Collingwood | Ontario | Canada |
|---|---|---|---|
| Very good or excellent health | 54% | 51% | 52% |
| Life expectancy at birth | 81.5 | 82.8 | 81.5 |
| Smokers | 12% | 10% | 12% |
Statistics Canada, Canadian Community Health Survey 2023/2024 and life expectancy 2022/2024; Open Database of Healthcare Facilities
The schools around Collingwood answer to 3 boards
Taken together, Collingwood and its 3 km edge hold 7 elementary schools and 2 secondary schools for 4,780 students. Over three years, results rose at 3 of its 9 tested schools. On the tests, 1 of 9 schools land above the middle in Ontario, 2 under it. Schooling in French is on offer at one of the 9; in Ontario, 10% of schools teach in it.
| School | Level | Students | System |
|---|---|---|---|
| Admiral Collingwood Elementary School Second fifth in OntarioLargest elementary schoolElementary · Grades JK–8 | Elementary · Grades JK–8 | 600 | English public |
| Collingwood Collegiate Institute Fourth fifth in OntarioLargest secondary schoolSecondary · Grades 9–12 | Secondary · Grades 9–12 | 1,510 | English public |
| ÉÉC Notre-Dame-de-la-Huronie FrenchTeaches in FrenchElementary · Grades JK–8 | Elementary · Grades JK–8 | 130 | French Catholic |
Schools by system · Schools within 3 km
| Schools within 3 km | Collingwood | Ontario | Canada |
|---|---|---|---|
| School boards | 3 | 4 | 3 |
Provincial school lists and results, 2024-25
Trips to work from Collingwood are shorter than from Ontario’s towns or Canadian towns: 22 min on average
87% of commuters drove, near both Ontario’s towns (88%) and Canadian towns (89%).
How working residents got to work · census 2021
| Census 2021 | Collingwood | Ontario | Canada |
|---|---|---|---|
| Average trip | 22 min | 29 min | 26 min |
| Car or van | 87% | 88% | 89% |
Statistics Canada, Census 2021 (labour and commuting) · These are May 2021 figures, gathered while COVID-19 kept many people home or out of work.
July afternoons in Collingwood reach 25.3°C (Ontario towns 26.7°C, Canadian towns 25.5°C)
Frosty days number 131 in a normal year, lower than both Ontario’s towns (139) and Canadian towns (159). Expect January lows of around −8.7°C in Collingwood. December is the snowiest month, with 42 cm on average. Rain and snow peak in June, at 83 mm.
Average high by season · ECCC normals, 1991–2020
| Normals, 1991–2020 | Collingwood | Ontario | Canada |
|---|---|---|---|
| January night low | −8.7°C | −9.1°C | −13.5°C |
| July afternoon high | 25.3°C | 26.7°C | 25.5°C |
| Days with frost a year | 131 | 139 | 159 |
| Snowfall a year | 174 cm | 146 cm | 141 cm |
Environment and Climate Change Canada, Canadian Climate Normals 1991–2020 (Collingwood)
Older residents shape Collingwood: 30% are 65 or over, above Ontario’s towns and Canadian towns
13% of residents are children under 15. Visible minorities make up 6.9% of the population, below both Ontario’s towns (26%) and Canadian towns (15%).
Ages · Share of residents in each age group, Census 2021
Schooling · Highest qualification, residents 15 and over
Women and men · all residents
52.9% of Collingwood’s residents are women
Of the 2021 count, 13,115 were women and 11,700 men (women across Canada: 50.9%).
| Collingwood | Ontario | Canada | |
|---|---|---|---|
| Under 15 | 13% | 15% | 16% |
| 15 to 64 | 57% | 65% | 64% |
| 65+ | 30% | 19% | 19% |
| No certificate, diploma or degree | 14% | 15% | 16% |
| Postsecondary qualification | 56% | 56% | 56% |
Statistics Canada, Census 2021; Ontario and Canada: medians of towns of 2,500+
Collingwood earns a B for safety
For violence alone the index was 66, lower than both Ontario’s towns (76) and Canadian towns (86). Thefts, break-ins and damage came to 29.4 per 1,000 residents a year, near Ontario’s towns (30.5) and lower than Canadian towns (31.2).
Year by year · Crime Severity Index for each year
| 2023–2025 | Collingwood | Ontario | Canada |
|---|---|---|---|
| Violent Crime Severity Index | 66 | 76 | 86 |
| Property crime per 1,000 | 29.4 | 30.5 | 31.2 |
Statistics Canada, Uniform Crime Reporting Survey, 2023–2025 average
Collingwood in November: highs near 8°C, lows near 1°C
Expect about 72 mm of rain and snow over November. A typical November adds 22 cm of snow. Across the year, normals run from −9°C nights in January to 25°C afternoons in July. Hour-by-hour figures come from ECCC’s Collingwood forecast, on the Weather page.
Normal highs, the months ahead · ECCC normals, 1991–2020
| Season | High | Low | Rain and snow |
|---|---|---|---|
| Winter | 0°C | −7°C | 157 mm |
| Spring | 10°C | 1°C | 183 mm |
| Summer | 24°C | 15°C | 244 mm |
| Autumn | 14°C | 6°C | 210 mm |
ECCC normals, 1991–2020 (Collingwood); the forecast is on the Weather page
Fewer than 88% of Ontario’s lower-tier municipalities spend as much per resident as Collingwood
Federally, Collingwood sits in Simcoe—Grey, its riding (a federal electoral district, which elects one MP), held by Terry Dowdall of the Conservative Party of Canada.
| Turnout | Collingwood | Ontario | Canada |
|---|---|---|---|
| Municipal election, 2022 | 40% | 31% | 31% |
Wikidata, MAMH, MMAH, Statistics Canada
Collingwood Public Library logs 7 visits per person served, more than 95% of Ontario’s town libraries
Collingwood Public Library serves 24,811 people from a single building.
Provincial library statistics, OpenStreetMap, the CRA and Statistics Canada
Collingwood is 45 km from Georgian Bay Islands National Park
The 10 km around town hold 15 protected areas. 2.7 km from town is Wasaga Beach Provincial Park, the nearest provincial park. Within 10 km of the town, 3.9% of the land is protected, against 2.3% around a typical Canadian town. 3 beaches are mapped within 5 km, the nearest Sunset Point Beach.
Protected land · of the land within 10 km
| Outdoors | Collingwood | Ontario | Canada |
|---|---|---|---|
| Protected land within 10 km | 3.9% | 2.3% | 2.3% |
| Public protected areas within 10 km | 9 | 4 | 4 |
Canadian Protected and Conserved Areas Database (CPCAD), OpenStreetMap routes and beaches
Collingwood: 3 historic places, 2 with the highest designation
Go back to 1857 and you reach Lighttower, the oldest of them. Designations here include a provincial or municipal listing. Before 1961 is when nearly a fifth of the homes went up, lower than Ontario’s towns (22%) yet higher than Canadian towns (18%).
Historic places by designation · inside the town
Among them
| Heritage | Collingwood | Ontario | Canada |
|---|---|---|---|
| Homes built before 1961 | 19% | 22% | 18% |
Canadian Register of Historic Places, Directory of Federal Heritage Designations, Québec’s Répertoire du patrimoine culturel, Wikidata; Census 2021 homes by period
Blue Mountain Go Karts and 8 more in and around Collingwood
The best-known places to visit in and around Collingwood come first; the full list is on the Attractions page.
 Ski hillBlue Mountain2.6 km outside town, to the westMuseumMuseumCollingwood Museumin townSki hillSki hillCraigleith Ski Club4.1 km outside town, to the westSki hillSki hillOsler Bluff Ski Club2.7 km outside town, to the southwestAttractionAttractionGreat Northern Exhibition Grounds700 m outside town, to the east
Photos: each place’s Wikidata image, from Wikimedia Commons under the licence below (our copy, resized).
Photo credits (1)
- Blue Mountain: Niels Elgaard Larsen - (WT-en) Elgaard at English Wikivoyage, CC BY-SA 4.0, Wikimedia Commons
Everything we know about Collingwood
Famous people from Collingwood
30 notable people were born in Collingwood.

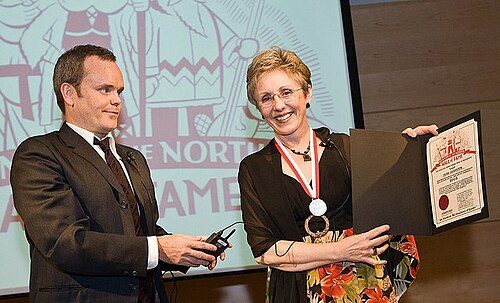


Photo credits
Reg Noble: Unknown author, Public domain · Lynn Johnston: mackbrad, CC BY 2.0 · Stacey Dales: Keith Allison from Hanover, MD, USA, CC BY-SA 2.0 · Mary-Margaret McMahon: Stephanie Clark, CC BY-SA 4.0
Collingwood’s neighbours
The nearest places of 1,000 or more. Statistics Canada
| Town | People | km | Overall | Cost | Safety | Health |
|---|---|---|---|---|---|---|
| Collingwood | 28,366 | — | B | D− | B | A− |
| Stayner | 16,571 | 13 | B | D | A | B+ |
| Wasaga Beach | 28,736 | 14 | D | D− | B+ | B+ |
| Thornbury | 11,162 | 17 | A− | D | A | C+ |
People: Statistics Canada, Census 2021. Distances: centre to centre.
Questions about Collingwood
Has Collingwood grown?
Between the 2016 and 2021 censuses it went from 21,793 to 24,811 residents (up 13.8%; Canadian towns’ median: 4.1%), and Statistics Canada now estimates 28,366.
Who are the people of Collingwood?
Visible minorities are 7% of the population, where the middle of Canadian towns is 15%. Immigrants make up 13%, and Indigenous people 2%.
What kind of homes are in Collingwood?
Mostly 56% single-detached houses (the median of Canadian towns: 64%), with 4% of homes in buildings of five or more storeys. Households hold 2.2 people on average, and 34% have just one.
About Collingwood
Town in Ontario
The boundary here is Statistics Canada’s: Collingwood is one census subdivision in Ontario, and TownRatings describes all of it.
Statistics Canada: population estimates 2025 (17-10-0155), Census of Population 2021, 2021 census boundaries.
- Population
- 28,366 (people, 2025 estimate)
- Province or territory
- Ontario
- Census division
- Simcoe
- Census subdivision
- 3543031
Sources: Statistics Canada, Census of Population 2021 · population estimates 2025 (17-10-0155) and 2021 census boundaries · Uniform Crime Reporting Survey 2023–25 (35-10-0026, 35-10-0183 to 35-10-0190) · CMHC rents as published by Statistics Canada (34-10-0133) · grades by TownRatings. Under the Statistics Canada Open Licence.
Adapted from Statistics Canada (Census of Population 2021, population estimates 2025, 2021 census boundaries) under the Statistics Canada Open Licence; this does not constitute an endorsement by Statistics Canada. Neighbourhood names in some cities © OpenStreetMap contributors (ODbL).