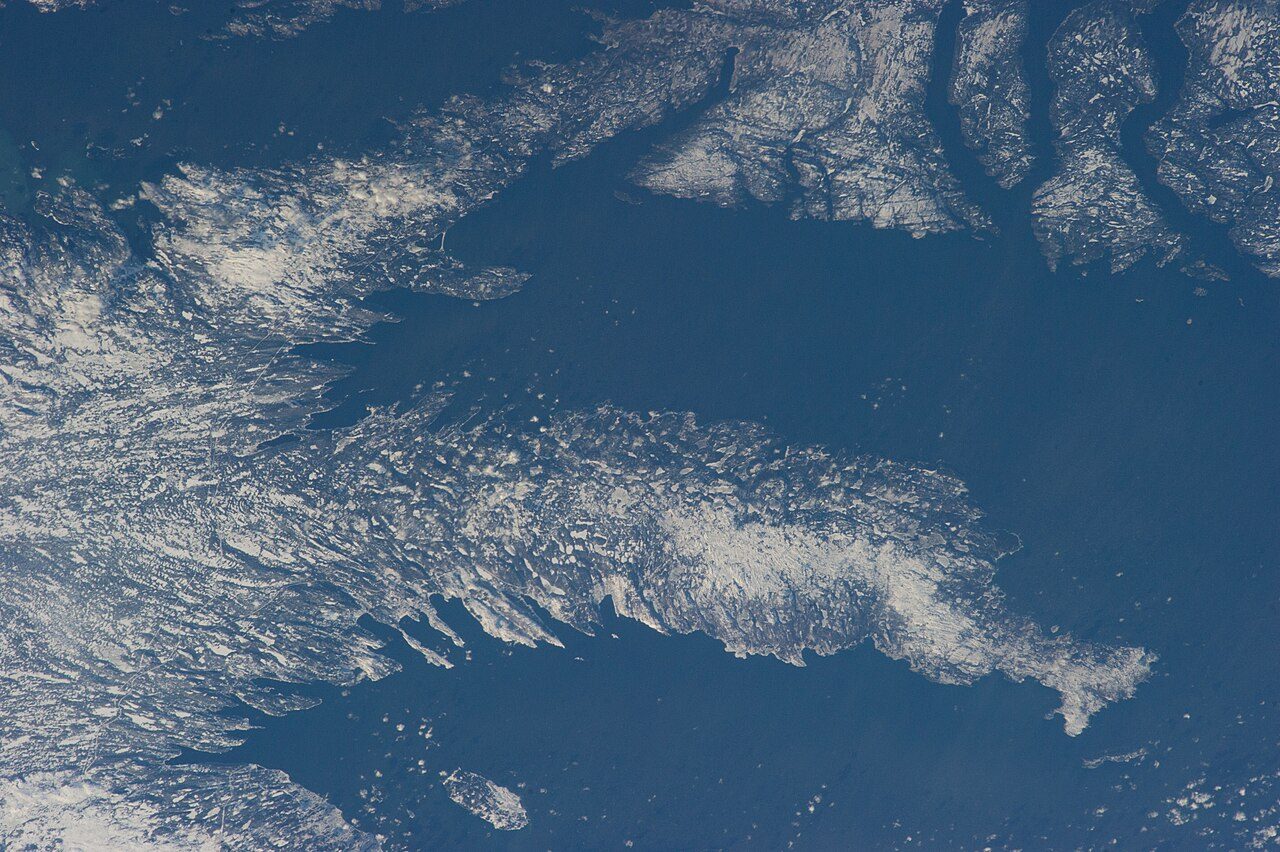
 Photo: Earth Science and Remote Sensing Unit , Lyndon B. Johnson Space Center · Public domain
Health in Division No. 7, Subdivision L trails 96% of Canadian towns
In the health survey, 44% of adults in the region rate their health very good or excellent, fewer than Newfoundland and Labrador’s 52%. What sets Division No. 7, Subdivision L apart within its region is a longer trip to hospital, 15 km for the average resident (3.7 km typical). Health gives Division No. 7, Subdivision L a grade of D−.
What stands out about health in Division No. 7, Subdivision L
More chronic illness
High blood pressure (36%) and diabetes (15%) push the region’s chronic-condition figure above the typical Canadian town’s. Conditions and habits ↓
Life expectancy below the norm
Division No. 7, Subdivision L’s region sits 2.9 years below the typical Canadian town, and those reaching 65 have 18.9 years ahead (2022/2024). The wider area ↓
More smokers
The age-standardised smoking rate around Division No. 7, Subdivision L is well above the typical town’s; 13% of adults are daily smokers. Conditions and habits ↓
Far from a hospital
Residents of Division No. 7, Subdivision L live much further from a hospital than in the typical Canadian town (17 km from its centre of population), and 0% are more than 30 km away. Getting care ↓
From Statistics Canada: the health survey and life expectancy for the health region, the deprivation index for the town; distances from the healthcare facilities database and OpenStreetMap.
Division No. 7, Subdivision L grades D− for health
Each input ranked against Canadian towns of 2,500 or more: the region’s four, the town’s distance to a hospital.
The region’s four figures and the town’s distance to a hospital are each ranked against Canadian towns of 2,500 or more, then averaged.
How the grade works
Health is graded as a regional score, labelled as such: very good or excellent self-rated health, chronic conditions (arthritis, diabetes and high blood pressure averaged) and smoking from the Canadian Community Health Survey, each age-standardised so an older region isn’t marked down for age alone, and life expectancy at birth, all for the health region. The residents’ average distance to a hospital is the one input measured for the town itself, so towns in one region can still differ.
36% of the region’s adults have high blood pressure and 15% diabetes
What the survey finds on conditions, weight and habits for the region, the province as the tick.
Conditions and weight · 2023/2024
Habits · 2023/2024
Self-reported obesity, 48%, tops Newfoundland and Labrador (42%).
Canadian Community Health Survey 2023/2024 (table 13-10-0972), as published, not adjusted for age; obesity from reported height and weight.
Life expectancy across the 5 health regions in Newfoundland and Labrador
Regional life expectancy in Newfoundland and Labrador, then the town’s place on the national deprivation index.
Life expectancy at birth by health region · 2022/2024
The region comes 3rd of 5 in Newfoundland and Labrador, where life expectancy runs from 77.1 to 80.2 years.
Canadian Index of Multiple Deprivation · national quintile, 1 least to 5 most deprived
The index is context and never graded: it describes Division No. 7, Subdivision L’s own areas, averaged over residents, on each of its four dimensions.
Life expectancy: Statistics Canada table 13-10-0988, three-year estimate 2022/2024, by health region.
From Division No. 7, Subdivision L, a hospital is 15 km away on average
Measured from where the town’s residents live, so this part is Division No. 7, Subdivision L’s own, not the region’s.
Compared with 8.5 km for the typical town in Newfoundland and Labrador and 3.7 km for the typical Canadian town, Division No. 7, Subdivision L is on the far side.
Hospitals and clinics: Statistics Canada, Open Database of Healthcare Facilities. Pharmacies: © OpenStreetMap contributors (ODbL). Straight-line distances from each dissemination area, weighted by its 2021 population.
Life expectancy about where the region’s deprivation puts it, a shade above
Regions, not towns, with every town in a region sharing its dot: of the 102, the marked one, Division No. 7, Subdivision L’s, follows the trend.
At 3.7 on the index, regions tend to reach 78.3 years (correlation −0.83, 102 regions), and the one Division No. 7, Subdivision L belongs to reaches 78.6. It outlives 6 of the 10 regions nearest it on the index, whose median is 78.2 years.
Life expectancy: Statistics Canada table 13-10-0988, 2022/2024, by health region. Deprivation: Canadian Index of Multiple Deprivation 2021 (situational vulnerability), averaged over each region’s towns by their residents; income: 2021 Census median household income, averaged the same way. The averages and the line are TownRatings calculations.
42% in the region call their health very good or excellent, fewer than in Newfoundland and Labrador (50%)
How adults in the health region answered the survey, not adjusted for age; the tick marks the province.
Share of adults, as answered · 2023/2024
Mental health is close to the province’s: 56% rate it very good or excellent, against 54% in Newfoundland and Labrador, and 15% find most days quite stressful.
Canadian Community Health Survey 2023/2024 (Statistics Canada table 13-10-0972), adults 18 and over, as published.
Health in the places around Division No. 7, Subdivision L
Nearby places: distance to a hospital and each one’s regional figures. Tap a town for its health page.
| Town | Hospital | Very good health | Life exp. | Health |
|---|---|---|---|---|
| Division No. 7, Subdivision L | 15 km | 44% | 78.6 | D− |
| Division No. 7, Subdivision K 11 km | 8.2 km | 44% | 78.6 | D |
| Division No. 7, Subdivision M 13 km | 20 km | 44% | 78.6 | D− |
| Clarenville 17 km | 2.0 km | 44% | 78.6 | D |
Every place around Division No. 7, Subdivision L shares its health region, so their survey figures match; only the distance to care differs. Residents of Clarenville live nearer a hospital, at 2.0 km against 15 km in Division No. 7, Subdivision L.
What this data can and can’t tell you
- Deprivation is context. The Canadian Index of Multiple Deprivation (2021) is context, never graded, and the territories have none.
- Who the survey asks. The health survey leaves out people living on reserves, full-time Canadian Forces members, people in institutions, and Nunavik and the Cree lands of James Bay.
- Adjusted for age. Standardising for age lets a retirement region and a young one be set side by side; the charts keep the raw answers, the grade the standardised ones.
- Distances are straight lines. Each small census area is measured as the crow flies to the nearest facility and weighted by its 2021 residents, so real trips run longer.
- What counts as a hospital. Facility locations come from Statistics Canada’s open database; records without coordinates sit at their postal code, and not every hospital has an emergency room.
- Regional figures. Only the distances on this page belong to Division No. 7, Subdivision L alone, because the health survey and life expectancy come for the whole health region.
Questions about health in Division No. 7, Subdivision L
How healthy is Division No. 7, Subdivision L?
On every regional measure, the region does worse than the typical Canadian town. Its chronic-condition figure, age-standardised, is 24%.
What is the life expectancy in Division No. 7, Subdivision L?
Women in Division No. 7, Subdivision L’s region live to 80.8 on average and men to 76.4, Statistics Canada’s 2022/2024 estimate.
How is Division No. 7, Subdivision L’s Health Grade worked out?
Not yet: Health will weigh the region’s survey and life expectancy and Division No. 7, Subdivision L’s distance to a hospital against the typical Canadian town once Canada’s grading run happens.
How far is Division No. 7, Subdivision L from a hospital?
Residents of Division No. 7, Subdivision L have a clinic 57 km away on average and a pharmacy 15 km away, in straight lines.
Sources: Statistics Canada, Canadian Community Health Survey 2023/2024 (13-10-0972) · Statistics Canada, life expectancy 2022/2024 (13-10-0988) · Statistics Canada, health regions 2023 (82-402-X) · Statistics Canada, Open Database of Healthcare Facilities · pharmacies © OpenStreetMap contributors (ODbL) · Statistics Canada, Canadian Index of Multiple Deprivation 2021. Under the Statistics Canada Open Licence.
Adapted from Statistics Canada (Census of Population 2021, population estimates 2025, 2021 census boundaries) under the Statistics Canada Open Licence; this does not constitute an endorsement by Statistics Canada. Neighbourhood names in some cities © OpenStreetMap contributors (ODbL).