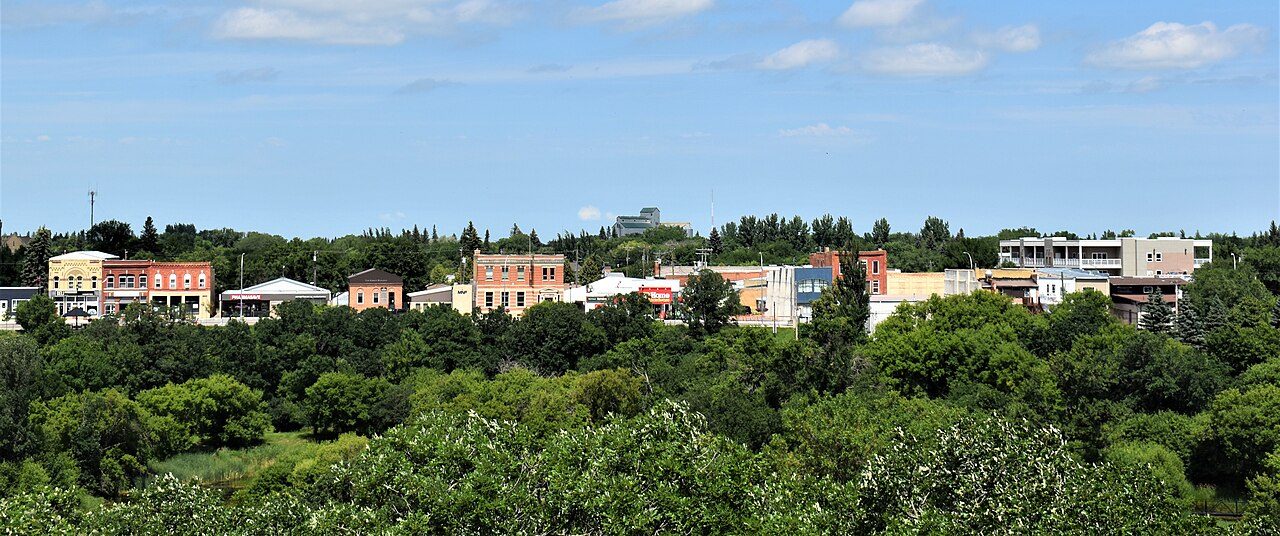
 Photo: Words in the Wind · CC BY-SA 4.0
How Souris works: jobs, income and commuting
Median household income in Souris was $73,000 in 2020; the middle of Canadian towns is $85,900. 6.8% of the labour force in Souris was out of work at the 2021 census, next to 9.9% for the middle of Canadian towns. Of Souris’ residents aged 15 to 64, 76% were employed when the 2021 census was taken, against 73% in the middle of Canadian towns.
What stands out about work in Souris
Less unemployment than most towns
On census day in 2021 6.8% were unemployed, against 9.9% in the middle of Canadian towns; by October 2026 the Labour Force Survey put the area at 5.8%. Unemployment ↓
Lower incomes than most towns
Half the households here had more than $73,000 in 2020, against $85,900 in the middle of Canadian towns. Household income ↓
Written from the data on this page: Statistics Canada’s 2021 Census, its commuting tables, Employment Insurance and the Labour Force Survey.
Jobs and income in Souris earn B−
Better than 50% of Canadian towns on three measures together, #117 of 185 in Manitoba.
Its strongest measure is trip times; its weakest, household income.
Graded against Canadian towns of 2,500 people or more; less unemployment and a shorter commute count in its favour.
How the grade works
Census 2021 measures, weighed equally against every Canadian town and neighbourhood of 2,500 people or more: the share of residents aged 15 to 64 in work, median household income (2020), the unemployment rate and the average commute. Each becomes a percentile; their average sets the letter.
76% of working-age people in Souris have jobs
Of the 3 other places of 2,500 people or more in Census Division No. 7, 2 have a smaller share of 15-to-64s in work.
The labour force, people 15 and over with a job or seeking one, took in 62% of residents that age. Many residents are past working age, so among everyone 15 and over the share in work drops to 58%. In October 2026, 60% of the wider area’s adults had a job, on the Labour Force Survey’s count. The census was taken on 11 May 2021, mid-pandemic, when lockdowns had pushed unemployment up and sent many to work from home.
Statistics Canada, 2021 Census: people in work of any age over residents aged 15 to 64, and the census unemployment rate (15 and over); the 25-to-54 rate is Statistics Canada’s own (98-10-0485). The Labour Force Survey and business counts are context, not grade inputs.
Earnings at home in Souris: households
Before tax, 2020: lower than in 59% of Canadian towns.
Every other place of 2,500 or more in Census Division No. 7 has a higher median. Against the middle of Manitoba’s towns ($83,900), Souris’ median is 13% below. Pandemic support paid in 2020, CERB first among it, is part of these before-tax incomes.
Statistics Canada, 2021 Census: median total income of households in 2020, before tax (a neighbourhood’s estimated from its dissemination areas’ income groups).
In and out of Souris: the working day evens out
The job is inside the municipality for 58% of its commuters (70% in the middle of Canadian towns).
People with no fixed workplace are in neither count.
42% of Souris’ residents in work leave it to work; Brandon takes the most
Brandon sends the largest group the other way, 70 people.
Statistics Canada, 2021 Census (98-10-0459): commuting flows between municipalities (census subdivisions), rounded to 5; linked names have their own pages.
Walking, cycling or transit: 13% of Souris’ commuters
Home was the workplace for 14%, under the 21% in the middle of Canadian towns. Transit barely figures here, against 3.5% in the middle of Canadian towns. The car takes 86% of commuters here, under the 87% in the middle of Manitoba’s towns.
Statistics Canada, 2021 Census: main mode of commuting; average durations by mode from table 98-10-0458 (whole municipalities only).
At 23.3 minutes, commutes from Souris are shorter than in the middle of Canadian towns
Trips under 15 minutes: 51%, more than the 46% in the middle of Manitoba’s towns. An hour or more: 5.9% of commuters, close to the middle of Manitoba’s towns. Statistics Canada’s own average, timed exactly rather than by band, is 21.2 minutes.
Statistics Canada, 2021 Census: commuting duration in five bands; our average uses each band’s middle (75 minutes for an hour or more), so it runs about two minutes above Statistics Canada’s own.
In Census Division No. 7, 17% more people receive EI than in 2019
For EI beneficiaries, the only official count covers all of Census Division No. 7, Souris included.
Per 100 residents aged 15 to 64, about 3.8 receive EI. Over the year to August 2026, the count fell by 8%. The count topped out in January 2021 at 3,630 people, 2.6 times the 2019 average.
Statistics Canada, Employment Insurance beneficiaries by census division (14-10-0323): all income benefits, not seasonally adjusted. EI counts are context, not part of any grade.
People receiving Employment Insurance each month, as a share of the 2019 average (100).
Souris on foot: a A grade
Better than 92% of Canadian towns on two measures together, #59 of 185 in Manitoba.
OpenStreetMap (© OpenStreetMap contributors, ODbL); active commuting from the 2021 Census.
Out of 497 Canadian towns of 2,500 to 3,700, Souris comes 245th on jobs and income
| # | Place | People | In work, 15–64 | Unemployment | Household income | Grade |
|---|---|---|---|---|---|---|
| 1 | Upper Mount Royal Alberta | 2,758 | 83% | 12% | $188K | A+ |
| 2 | Central River Heights Manitoba | 2,736 | 84% | 5.4% | $137K | A+ |
| 3 | Crescentwood Manitoba | 3,060 | 87% | 5% | $123K | A+ |
| … | ||||||
| 7 | South River Heights Manitoba | 2,632 | 84% | 5.3% | $112K | A+ |
| … | ||||||
| 243 | Merrickville-Wolford Ontario | 3,411 | 81% | 7.5% | $88K | B− |
| 244 | Caswell Hill Saskatchewan | 2,573 | 67% | 7.4% | $75K | B− |
| 245 | Souris-Glenwood Manitoba | 2,737 | 76% | 6.8% | $73K | B− |
| 246 | Carrington Alberta | 2,920 | 73% | 9.6% | $118K | B− |
| 247 | City Commercial Core Ontario | 2,581 | 78% | 8.6% | $68K | B− |
| … | ||||||
| 497 | Division No. 8, Subdivision L Newfoundland and Labrador | 2,724 | 43% | 30% | $51K | D− |
Ordered by Jobs & income Grade: the top three, the places either side of Souris, and others among Manitoba’s towns.
Jobs near Souris: the places around it
The nearest places to Souris with figures are 21–30 km away.
| Place | In work, 15–64 | Unemployment | Household income | Average trip | Jobs | Walk |
|---|---|---|---|---|---|---|
| Souris | 76% | 6.8% | $73K | 23.3 min | B− | A |
| Whitehead 21.1 km | 82% | 5.2% | $105K | 25.9 min | A | C− |
| Grassland 24.6 km | 76% | 5.4% | $76K | 22.4 min | B | B+ |
| Sioux Valley Dakota Nation 29.8 km | 35% | 18% | $47K | 16 min | D | C− |
The people of each place: the share in work, unemployment, household income and the average commute, with both grades once they come.
What this data can and can’t tell you
What each figure measures for Souris, where it comes from, and what it leaves out.
- Household income. The 2020 income of the household at the midpoint, all sources and before tax. Inside a city we rebuild it from the dissemination areas’ income bands, so there it is an estimate.
- Trip times. Commuters picked a band for their usual trip (under 15 minutes, 15 to 29, and so on). We place each person at the middle of their band, which lands a little above Statistics Canada’s own timed average.
- Where people commute. Jobs count everyone whose usual workplace lies in the municipality, residents or commuters from elsewhere, from Statistics Canada’s home-by-workplace table.
- Employment Insurance. A monthly count of Employment Insurance beneficiaries for the whole census division. It tracks the local job market, but it is not an unemployment rate.
- The Labour Force Survey. A monthly household survey by Statistics Canada, reported for metro areas and economic regions only. It supplies a recent rate next to the 2021 census figure.
- In work. Working residents per resident of working age (15 to 64), from the 2021 Census.
- Unemployment. The share of people 15 and over in the labour force, working or looking for work, who had no job on census day in May 2021.
- Which towns we compare. The comparison pool is places of 2,500 people or more, towns or neighbourhoods inside cities, without whole cities or reserves, and we compare with its median.
- The municipality’s figures. Statistics Canada counts Souris as part of Souris-Glenwood, so every census figure on this page is the whole municipality’s.
Questions about work in Souris
Where do people in Souris work?
58% work in Souris itself; of those who leave, the most go to Brandon (165), then Grassland (35).
How many jobs are there in Souris?
The 2021 census counted about 695 people working in Souris: 1 jobs for every resident who commutes to a fixed workplace. Statistics Canada counted 114 businesses with employees in June 2026.
What is the unemployment rate in Souris?
At the 2021 census 6.8% of the labour force had no job and was looking (9.9% in the middle of Canadian towns). The latest monthly survey, for the Southwest economic region, gives 5.8% in October 2026.
What is the average household income in Souris?
At $73,000 before tax in 2020, the median household in Souris compares with $85,900 in the middle of Canadian towns.
How do people in Souris get to work?
By car: 86% of commuters, 13% walk; on census day 14% of those in work worked from home.
How long is the commute from Souris?
23.3 minutes is the average trip, with 51% of commuters there in under 15 minutes and 5.9% taking an hour or more.
Sources: Statistics Canada, 2021 Census of Population (Census Profile) · Statistics Canada, tables 98-10-0458 and 98-10-0459 (commuting) · Statistics Canada, table 14-10-0323 (EI beneficiaries) · Statistics Canada, Labour Force Survey (14-10-0459, 14-10-0462) · Statistics Canada, Canadian Business Counts (33-10-1176) · grades: TownRatings. Under the Statistics Canada Open Licence.
Adapted from Statistics Canada (Census of Population 2021, population estimates 2025, 2021 census boundaries) under the Statistics Canada Open Licence; this does not constitute an endorsement by Statistics Canada. Neighbourhood names in some cities © OpenStreetMap contributors (ODbL).