
ShaughnessyVancouver
A neighbourhood of 8,034 in Vancouver. Vancouver is split into 29 neighbourhoods, and this is one.
Is Shaughnessy a good place to live?
Strong in places, weak in others. Health outcomes beat most towns (A+). Walkability is another plus (A+). Housing is expensive (D). Police record more crime here than in most towns (C−). The overall grade comes out at B, #63 of 250 in British Columbia. Nationally, it does better than 57% of Canadian towns. Its other grades sit near the middle: B for jobs & income and B− for hazard risk.
Rents here are the metro area's average, shared by every town and neighbourhood in it. Safety less sure: this is the whole city's figure, because the city doesn't publish open neighbourhood crime rates. Health is graded on the health region's survey figures and life expectancy, with the distance to hospital giving the town its own spread.
How Shaughnessy grades
Each subject compares Shaughnessy with Canadian towns of 2,500 or more, ordered by how far it is from the middle. Towns in other countries are graded separately.
How TownRatings grades Canadian towns →
What makes Shaughnessy stand out
The 3 things Shaughnessy does most differently from other towns.
The data
Data highlights are ordered by what stands out in Shaughnessy.
Health in Shaughnessy beats 98% of Canadian towns
Lives in the region last 83.3 years on average (2022/2024): 86.5 for women, 80.2 for men. The three chronic conditions the survey tracks average 13% of adults, below both British Columbia’s towns (15%) and Canadian towns (17%). About as many adults call their health very good or excellent here as across British Columbia, 50% against 50%. The region has fewer smokers than British Columbia, 7.3% of adults to 8.9%.
Very good or excellent health · adults, age-standardised
| Health | Shaughnessy | British Columbia | Canada |
|---|---|---|---|
| Chronic conditions (average share) | 13% | 15% | 17% |
| Life expectancy at birth | 83.3 | 81.0 | 81.5 |
| Smokers | 7.3% | 9% | 12% |
| Very good or excellent health | 50% | 50% | 52% |
Statistics Canada, Canadian Community Health Survey 2023/2024 and life expectancy 2022/2024; Open Database of Healthcare Facilities · Area behind the health survey and life expectancy figures: the Vancouver Health Service Delivery Area
Measured against local pay, Shaughnessy costs more to live in than nine in ten Canadian towns
Area-wide: rent as a share of income and monthly rent for a two-bedroom, counted over the Vancouver metro area
37% of households spent 30% or more of their income on shelter, higher than both British Columbia’s towns (21%) and Canadian towns (18%). Home ownership covers 73% of households.
What homes were worth · The median owner’s estimate at the 2021 census
| Census 2021 | Shaughnessy | British Columbia | Canada |
|---|---|---|---|
| Households spending 30%+ on shelter | 37% | 21% | 18% |
| Rent as a share of income | 21% | 24% | 20% |
Statistics Canada, Census 2021; CMHC Rental Market Survey via Statistics Canada · The 2021 census asked owners what their home was worth; those values, and 2020 incomes, are what this compares.
Winters are mild in Shaughnessy: January nights hold at 3.3°C, above British Columbia’s towns and Canadian towns
A normal November brings 245 mm of precipitation, more than any other month. Frost comes on 17 days a year, below British Columbia’s towns (60) and Canadian towns (159) alike. Also worth knowing: a July afternoon in Shaughnessy typically reaches 23.0°C. December is the snowiest month, with 14 cm on average.
Average high by season · ECCC normals, 1991–2020
| Normals, 1991–2020 | Shaughnessy | British Columbia | Canada |
|---|---|---|---|
| Days with frost a year | 17 | 60 | 159 |
| January night low | 3.3°C | 0.5°C | −13.5°C |
| Precipitation a year | 1,537 mm | 1,152 mm | 883 mm |
| Snowfall a year | 37 cm | 51 cm | 141 cm |
Environment and Climate Change Canada, Canadian Climate Normals 1991–2020 (Vancouver (Harbour))
Crime runs heavier where Shaughnessy is policed than in British Columbia’s towns or Canadian towns, at an index of 93
Property crime in its police area ran at 43.6 per 1,000 residents a year, above both British Columbia’s towns (31) and Canadian towns (31.2). The violent index for its police area came to 99, above both British Columbia’s towns (76) and Canadian towns (86).
Year by year · Crime Severity Index for each year
| 2023–2025 | Shaughnessy | British Columbia | Canada |
|---|---|---|---|
| Property crime per 1,000 | 43.6 | 31 | 31.2 |
| Crime Severity Index | 93 | 83 | 67 |
| Violent Crime Severity Index | 99 | 76 | 86 |
Statistics Canada, Uniform Crime Reporting Survey, 2023–2025 average · Not measured by town: Crime Severity Index, Violent Crime Severity Index, violent crime and property crime per 1,000 (the Vancouver service area)
Results around Shaughnessy lean high: 42 of 65 schools in the top two fifths in British Columbia
In French: 3 of the 79 schools, where in British Columbia the share is 2%. Independent schools number 31 of 79, above the 18% in British Columbia. Within 3 km of Shaughnessy are 59 elementary schools, 13 secondary schools, 3 schools for every grade and 4 alternative or adult schools.
| School | Level | Students | System |
|---|---|---|---|
| Little Flower Academy IndependentIn ShaughnessyElementary | Elementary | – | Independent |
| Point Grey Secondary Middle fifth in British ColumbiaIn ShaughnessySecondary | Secondary | – | English public |
| Rose-des-vents FrenchTeaches in FrenchElementary | Elementary | – | French public |
| Claren Academy IndependentResults in the top fifth in British ColumbiaElementary | Elementary | – | Independent |
Schools by system · Schools within 3 km
| Schools within 3 km | Shaughnessy | British Columbia | Canada |
|---|---|---|---|
| School boards | 2 | 2 | 3 |
Provincial school lists and results, 2025/26
Fewer commuters in Shaughnessy drive than in British Columbia’s towns or across Canadian towns: 71%
The average trip to work took 26 min, close to both British Columbia’s towns (26 min) and Canadian towns (26 min).
How working residents got to work · census 2021
| Census 2021 | Shaughnessy | British Columbia | Canada |
|---|---|---|---|
| Car or van | 71% | 87% | 89% |
| Average trip | 26 min | 26 min | 26 min |
Statistics Canada, Census 2021 (labour and commuting) · The 2021 census was taken in May 2021, during COVID-19 restrictions: more people than usual worked from home or were off work.
Visible minorities make up more of Shaughnessy than of British Columbia’s towns or Canadian towns: 60%
0.6% of residents have an Indigenous identity, below both British Columbia’s towns (5%) and Canadian towns (2.8%). Children under 15 count for 13% of the people here. People 65 and over make up 22% of the town.
Ages · Share of residents in each age group, Census 2021
Schooling · Highest qualification, residents 15 and over
Women and men · all residents
52.6% of Shaughnessy’s residents are women
Of the 2021 count, 4,230 were women and 3,815 men (women across Canada: 50.9%).
| Shaughnessy | British Columbia | Canada | |
|---|---|---|---|
| Under 15 | 13% | 14% | 16% |
| 15 to 64 | 65% | 64% | 64% |
| 65+ | 22% | 21% | 19% |
| No certificate, diploma or degree | 7.7% | 13% | 16% |
| Postsecondary qualification | 72% | 56% | 56% |
Statistics Canada, Census 2021; British Columbia and Canada: medians of towns of 2,500+
In Shaughnessy, November normally means 10°C afternoons and 5°C nights
Precipitation in November averages 245 mm. December follows at 7°C by day and 3°C by night. ECCC’s forecast for Vancouver is on the Weather page, hour by hour.
Normal highs, the months ahead · ECCC normals, 1991–2020
| Season | High | Low | Rain and snow |
|---|---|---|---|
| Winter | 8°C | 3°C | 554 mm |
| Spring | 14°C | 7°C | 353 mm |
| Summer | 22°C | 14°C | 158 mm |
| Autumn | 14°C | 9°C | 473 mm |
ECCC normals, 1991–2020 (Vancouver (Harbour)); the forecast is on the Weather page
In 2021, Vancouver Granville went by only 431 votes, narrower than in 98% of ridings
Vancouver’s council runs Shaughnessy, one of the city’s neighbourhoods.
Wikidata, MAMH, MMAH, Statistics Canada
No public library stands in Shaughnessy: the closest, Oakridge Branch, is 1.6 km away
Vancouver Public Library serves the whole of Vancouver, so the library figures on this page are the city’s: 742,394 people, Shaughnessy among them.
Provincial library statistics, OpenStreetMap, the CRA and Statistics Canada
Few places match Shaughnessy for protected land nearby: more than 9 in 10 Canadian towns
Within 10 km are 12 protected areas. Biggest among them: Sturgeon Bank Wildlife Management Area, 7,775 ha, 4.0 km off. One named trail is close: the The Trans Canada Trail. For a national park, Gulf Islands National Park Reserve is 41 km away.
Protected land · of the land within 10 km
| Outdoors | Shaughnessy | British Columbia | Canada |
|---|---|---|---|
| Protected land within 10 km | 13% | 6.7% | 2.3% |
| Public protected areas within 10 km | 10 | 14 | 4 |
Canadian Protected and Conserved Areas Database (CPCAD), OpenStreetMap routes and beaches
Earthquakes are Shaughnessy’s biggest hazard: $0.43 of damage a year per $1,000 of buildings, 14 times the norm
Shared with the rest of the Vancouver health region: radon tests
1.2% of radon tests in the survey area came in above the guideline, below British Columbia’s towns (1.8%) and Canadian towns (6.6%) alike. Wildfire is rare near Shaughnessy: 0.2% of the land within 25 km has burned since 1986, a burn rate of 0.005% a year. No flood study for Shaughnessy is on the national inventory.
Radon tests above the guideline · share of tested homes, 200 Bq/m³
| Hazards | Shaughnessy | British Columbia | Canada |
|---|---|---|---|
| Earthquake loss per $1,000 of buildings a year | $0.43 | $0.36 | $0.030 |
| Radon tests above the guideline | 1.2% | 1.8% | 6.6% |
NRCan seismic risk model and burned areas, Health Canada radon survey, the Flood Hazard Map Inventory · Earthquake risk: the city of Vancouver
Before 1961: 50% of the homes in Shaughnessy
| Heritage | Shaughnessy | British Columbia | Canada |
|---|---|---|---|
| Homes built before 1961 | 50% | 11% | 18% |
Canadian Register of Historic Places, Directory of Federal Heritage Designations, Québec’s Répertoire du patrimoine culturel, Wikidata; Census 2021 homes by period
Everything we know about Shaughnessy
VanDusen Botanical Garden and 91 more in and around Shaughnessy
Sights in Shaughnessy and close by, ordered by how widely each is known.
 GardenVanDusen Botanical Gardenin town
 GardenStanley Park4.7 km outside town, to the northeast
 MuseumMuseum of Vancouver2.1 km outside town, to the north · 78K visitors a year
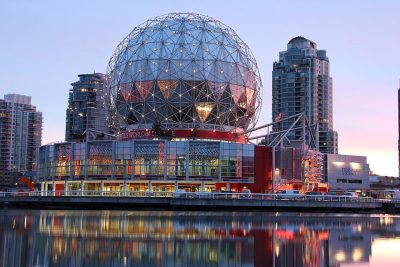 Big drawMuseumScience World2.5 km outside town, to the northeast · 650K visitors a year
 GardenQueen Elizabeth Park900 m outside town, to the southeast
 CathedralCathedral of Our Lady of the Rosary, Vancouver2.9 km outside town, to the northeast
Photos: each place’s Wikidata image, from Wikimedia Commons under the licence below (our copy, resized).
Photo credits (6)
- VanDusen Botanical Garden: Stan Shebs, CC BY-SA 3.0, Wikimedia Commons
- Stanley Park: squeakymarmot, CC BY 2.0, Wikimedia Commons
- Museum of Vancouver: Bobanny, Public domain, Wikimedia Commons
- Science World: Differense, CC BY-SA 3.0, Wikimedia Commons
- Queen Elizabeth Park: Craig Nagy from Vancouver, Canada, CC BY-SA 2.0, Wikimedia Commons
- Cathedral of Our Lady of the Rosary, Vancouver: Bobanny, Public domain, Wikimedia Commons
About Shaughnessy
Neighbourhood in Vancouver
The edges of Shaughnessy follow census dissemination areas, which TownRatings groups into Vancouver’s neighbourhoods; the name comes from the city’s map or OpenStreetMap.
Statistics Canada: population estimates 2025 (17-10-0155), Census of Population 2021, 2021 census boundaries.
- Population
- 8,034 (people, 2021 estimate)
- Province or territory
- British Columbia
- City
- Vancouver
- Census subdivision
- 5915022
Shaughnessy’s neighbours
The nearest places of 1,000 or more. Statistics Canada
| Town | People | km | Overall | Cost | Safety | Health |
|---|---|---|---|---|---|---|
| Shaughnessy | 8,034 | — | B | D | C− | A+ |
| South Cambie | 9,846 | 1.4 | B | D− | C− | A+ |
| Arbutus Ridge | 15,083 | 1.9 | B− | D− | C− | A+ |
| Oakridge | 14,071 | 2.1 | C+ | D− | C− | A+ |
| Fairview | 33,969 | 2.2 | B+ | D− | C− | A+ |
| Riley Park | 23,682 | 2.3 | B | D− | C− | A+ |
| Kerrisdale | 14,105 | 2.4 | B | D− | C− | A+ |
People: Statistics Canada, Census 2021. Distances: centre to centre.
Questions about Shaughnessy
Is Shaughnessy a young town or an old one?
At 45.1, its median age compares with 45.2 across Canadian towns. Children make up 13% of the population and seniors 22%.
Sources: Statistics Canada, Census of Population 2021 · population estimates 2025 (17-10-0155) and 2021 census boundaries · Uniform Crime Reporting Survey 2023–25 (35-10-0026, 35-10-0183 to 35-10-0190) · CMHC rents as published by Statistics Canada (34-10-0133) · grades by TownRatings. Under the Statistics Canada Open Licence.
Adapted from Statistics Canada (Census of Population 2021, population estimates 2025, 2021 census boundaries) under the Statistics Canada Open Licence; this does not constitute an endorsement by Statistics Canada. Neighbourhood names in some cities © OpenStreetMap contributors (ODbL).