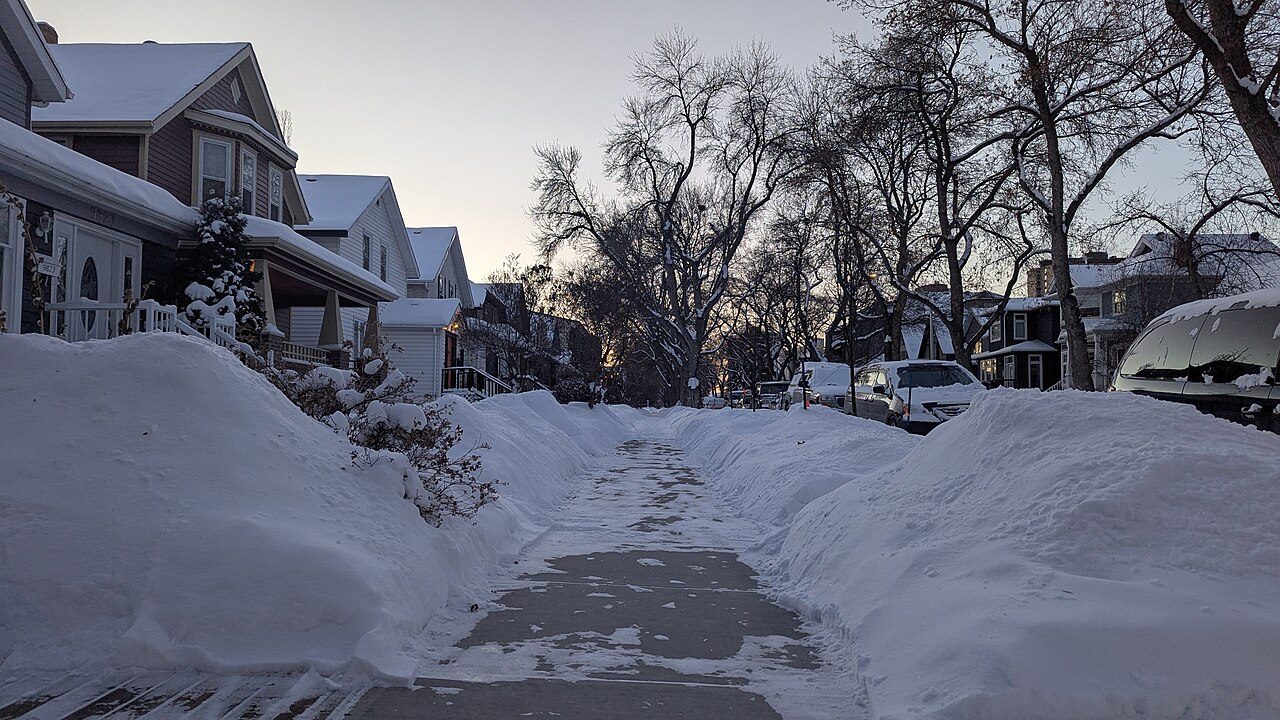
 Photo: Joli Rumi · CC BY-SA 4.0
Households in Strathcona earn less than those in 78% of Canadian towns
Working at home: 34% of its workers, where the middle of Canadian towns has 21%. Strathcona counted 79% of its 15-to-64s in jobs at the 2021 census; the middle of Canadian towns is 73%. When the 2021 census was taken, 12% of people in Strathcona who wanted a job had none, and the middle of Canadian towns sits at 9.9%.
Strathcona at work: what stands out
More people in work than most towns
Counting everyone 15 and over, 67% were in work at the 2021 census; among those aged 15 to 64 it was 79%, against 73% in the middle of Canadian towns. In work ↓
Lower incomes than most towns
The median household had $64,700 before tax in 2020; the middle of Canadian towns is $85,900. Household income ↓
Many work from home
On census day, 34% of those in work were working at home; the middle of Canadian towns is 21%. Getting to work ↓
Written from the data on this page: Statistics Canada’s 2021 Census, its commuting tables, Employment Insurance and the Labour Force Survey.
Strathcona earns C+ for jobs and income
Better than 42% of Canadian towns on three measures together, #316 of 474 in Alberta.
Its strongest measure is the share of 15-to-64s in work; its weakest, household income.
Graded against Canadian towns of 2,500 people or more; less unemployment and a shorter commute count in its favour.
How the grade works
Census 2021 measures, weighed equally against every Canadian town and neighbourhood of 2,500 people or more: the share of residents aged 15 to 64 in work, median household income (2020), the unemployment rate and the average commute. Each becomes a percentile; their average sets the letter.
In and out of work in Strathcona
Of the 211 other places of 2,500 people or more in Census Division No. 11, 197 have a smaller share of 15-to-64s in work.
Take in all adults, retirees with them, and only 67% were working. By October 2026, the Labour Force Survey had 64% of the wider area’s adults in work. Participation, the share of residents 15 and over working or looking for work, came to 76%. These are census figures from May 2021, during COVID’s third wave; jobs have recovered since, which the Labour Force Survey shows.
Statistics Canada, 2021 Census: people in work of any age over residents aged 15 to 64, and the census unemployment rate (15 and over); the 25-to-54 rate is Statistics Canada’s own (98-10-0485). The Labour Force Survey and business counts are context, not grade inputs.
Household income in Strathcona: $64,700 at the median
Set beside Alberta’s towns, where the median is $92,250, Strathcona sits 30% below. 193 of the 211 other places of 2,500+ in Census Division No. 11 have a higher median. CERB and the other emergency payments of 2020 are counted in these incomes, which lifted the lower ones that year.
Statistics Canada, 2021 Census: median total income of households in 2020, before tax (a neighbourhood’s estimated from its dissemination areas’ income groups).
Walking, cycling or transit: 31% of Strathcona’s commuters
Cycling to work barely figures in the middle of Alberta’s towns; here, 5.1% cycle. Fewer drive than in the middle of Alberta’s towns: 65% against 88%. Transit takes 11% of commuters, above the 3.5% in the middle of Canadian towns.
Statistics Canada, 2021 Census: main mode of commuting; average durations by mode from table 98-10-0458 (whole municipalities only).
30% more people are on EI in Census Division No. 11 than in 2019
Per 100 residents aged 15 to 64, about 4.2 receive EI. In the twelve months to August 2026 the number fell by 5%. January 2021 was the busiest month, with 97,990 people on EI, 3.1 times 2019’s average.
Statistics Canada, Employment Insurance beneficiaries by census division (14-10-0323): all income benefits, not seasonally adjusted. EI beneficiaries: one figure for all of Census Division No. 11. EI counts are context, not part of any grade.
People receiving Employment Insurance each month, as a share of the 2019 average (100).
The walkability of Strathcona: A+
Better than almost every Canadian town on two measures together, #15 of 474 in Alberta.
OpenStreetMap (© OpenStreetMap contributors, ODbL); active commuting from the 2021 Census.
Among Canadian towns of 5,800 to 11,200, Strathcona ranks 425th of 683 for jobs and income
| # | Place | People | In work, 15–64 | Unemployment | Household income | Grade |
|---|---|---|---|---|---|---|
| 1 | Labrador City Newfoundland and Labrador | 7,965 | 79% | 5.5% | $146K | A+ |
| 2 | Silverwood Heights Saskatchewan | 8,153 | 81% | 5.8% | $118K | A+ |
| 3 | North River Heights Manitoba | 7,228 | 82% | 8.4% | $143K | A+ |
| … | ||||||
| 8 | Altadore Alberta | 7,675 | 80% | 8.1% | $155K | A+ |
| … | ||||||
| 19 | West Hillhurst Alberta | 10,319 | 78% | 9.3% | $126K | A+ |
| … | ||||||
| 23 | Glenora Alberta | 6,197 | 78% | 9.1% | $123K | A+ |
| … | ||||||
| 423 | Alnwick/Haldimand Ontario | 8,197 | 75% | 12% | $103K | C+ |
| 424 | Notre-Dame-du-Mont-Carmel Quebec | 6,613 | 77% | 5% | $76K | C+ |
| 425 | Strathcona Alberta | 8,283 | 79% | 12% | $65K | C+ |
| 426 | Shediac New Brunswick | 9,849 | 72% | 10% | $67K | C+ |
| 427 | The Valleys of Thornhill Ontario | 9,979 | 73% | 10% | $140K | C+ |
| … | ||||||
| 683 | Beasley Ontario | 6,338 | 49% | 17% | $47K | D− |
Ordered by Jobs & income Grade: the top three, the places either side of Strathcona, and others among Alberta’s towns.
The work picture around Strathcona
| Place | In work, 15–64 | Unemployment | Household income | Average trip | Jobs | Walk |
|---|---|---|---|---|---|---|
| Strathcona | 79% | 12% | $65K | 24.4 min | C+ | A+ |
| Ritchie 1.4 km | 77% | 10% | $86K | 20.9 min | A− | A+ |
| Queen Alexandra 1.5 km | 67% | 14% | $57K | 23.7 min | D | A+ |
| Garneau 1.7 km | 64% | 13% | $59K | 22.3 min | D | A+ |
| Downtown 1.8 km | 76% | 13% | $68K | 23.6 min | C+ | A+ |
| Bonnie Doon 1.8 km | 73% | 11% | $74K | 23.6 min | C+ | A+ |
| Riverdale 2.1 km | 80% | 9.2% | $83K | 23.5 min | A− | A |
The people of each place: the share in work, unemployment, household income and the average commute, with both grades once they come.
What this data can and can’t tell you
What each figure measures for Strathcona, where it comes from, and what it leaves out.
- Household income. Half of households had more than this before tax in 2020, half less, counting every source of income. For a neighbourhood we estimate the median from the income brackets of its dissemination areas.
- Trip times. The census asks how long the trip to work usually takes, in bands; our average uses each band’s middle, so it runs a little above Statistics Canada’s timed average.
- Employment Insurance. A monthly count of Employment Insurance beneficiaries for the whole census division. It tracks the local job market, but it is not an unemployment rate.
- The Labour Force Survey. Statistics Canada surveys households every month; the results come out for metro areas and economic regions, never for single towns, and keep the rate current after 2021.
- In work. How many residents held a job in May 2021, set against how many were 15 to 64. It reads a little high where many people work past 65, since below the municipality the census gives no breakdown of workers by age.
- Unemployment. The census-week jobless rate for residents 15 and over. Its base is the labour force, those employed plus those actively looking.
- Which towns we compare. Every town and city neighbourhood with 2,500 residents or more; whole cities and First Nations reserves are left out. Each middle figure is a median.
- Neighbourhood figures. Commuting flows and Statistics Canada’s timed averages stop at the municipality, so Edmonton’s page carries them; Strathcona’s own figures sum its dissemination areas.
Questions about work in Strathcona
What is the average household income in Strathcona?
Strathcona’s middle household had $64,700 in 2020, before tax; Canadian towns have $85,900 at their middle.
How do people in Strathcona get to work?
65% of commuters go by car, 11% take public transit, 15% walk and 5.1% cycle. On census day 34% of everyone in work stayed home to work.
How many jobs are there in Strathcona?
The census places jobs by municipality, so the answer is in Edmonton’s figures, with the flows of its commuters.
What is the unemployment rate in Strathcona?
The census put unemployment at 12% in May 2021, where the middle of Canadian towns was 9.9%. More recently, in October 2026, the Labour Force Survey had the Edmonton metro area at 7.1%.
Sources: Statistics Canada, 2021 Census of Population (Census Profile) · Statistics Canada, table 14-10-0323 (EI beneficiaries) · Statistics Canada, Labour Force Survey (14-10-0459, 14-10-0462) · Statistics Canada, Canadian Business Counts (33-10-1176) · grades: TownRatings. Under the Statistics Canada Open Licence.
Adapted from Statistics Canada (Census of Population 2021, population estimates 2025, 2021 census boundaries) under the Statistics Canada Open Licence; this does not constitute an endorsement by Statistics Canada. Neighbourhood names in some cities © OpenStreetMap contributors (ODbL).