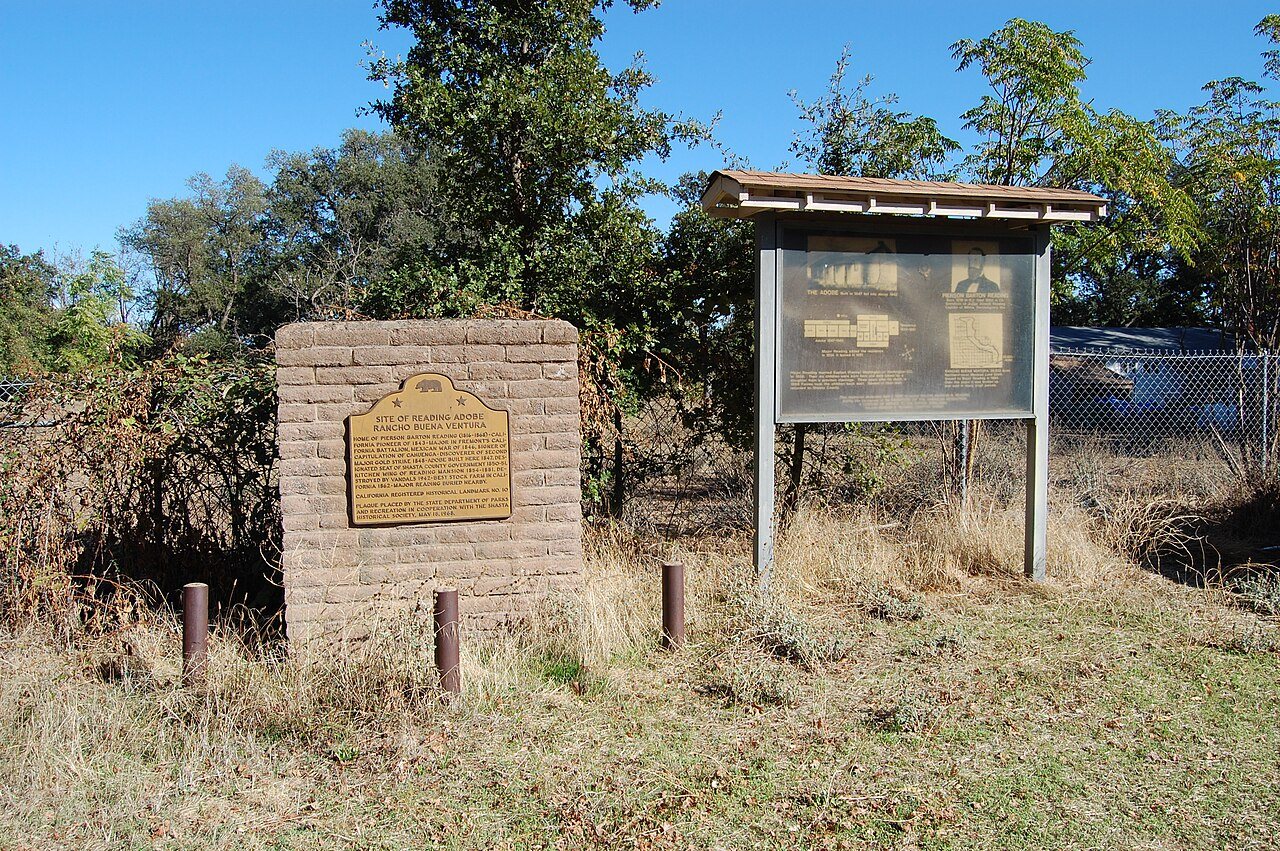
 Reading Adobe Site · Photo: Brian Jinnett · CC BY-SA 3.0
Few parks or trails are on the map in Lake California
3 acres are parks and preserves, 0.7 per 1,000 residents. 4.0 miles of mapped trail cross Lake California, 0.6 per square mile of land. 39% of residents live within a half mile of a park.
Ahead of 24% of U.S. towns · #728 of 847 in California State. What drives it
How much outdoors does Lake California have?
On conserved land, trails, park land and how close residents live to a park, Lake California is ahead of 24% of U.S. towns, #728 of 847 in California State. Trail miles hold the grade up; park acres per resident pull it down.
Water is 5% of Lake California’s area (0 of 7 square miles), so every share here is of land; over land and water together, the conserved share would read under 1%.
PAD-US, OpenStreetMap (© OpenStreetMap contributors), Census 2025 Gazetteer and 2020 blocks; details in Sources below. How TownRatings grades the outdoors →
Conserved land, trails & bike routes
Tap a number to zoom to a park. Tap a layer to hide it.
14 conserved acres
under 1% of Lake California’s land. Water is left out: Lake California has 6.3 square miles of land and 0.3 of water, so the share counts land only. Who manages Lake California’s conserved land, from the USGS Protected Areas Database. Approximate, because parcels can overlap.
Conserved doesn’t always mean open to visitors. 1 acre is a conservation easement, usually private land. The walks above are places people visit.
| Parcel (PAD-US) | Managed by | Acres | Public access |
|---|---|---|---|
| California State Lands Commission State Resource Management Area | State Department of Land | 13 | Open |
1 lakes & rivers
0.0 miles of bike routes
Bike lanes are often missing from the map in smaller towns, so that number is likely low.
Includes school and college facilities, which aren’t always open to the public.
The best walking months in Lake California: April and May
NOAA’s 1991–2020 normals for the town and the daylight at its latitude. Outlined months have long days, highs of 59 to 86 °F and little rain for the place.
| Jan | Feb | Mar | Apr | May | Jun | Jul | Aug | Sep | Oct | Nov | Dec | |
|---|---|---|---|---|---|---|---|---|---|---|---|---|
| Daylight (h) | 9.6 | 10.6 | 11.8 | 13.2 | 14.4 | 15.0 | 14.8 | 13.8 | 12.4 | 11.0 | 9.9 | 9.3 |
| High (°F) | 57 | 61 | 66 | 72 | 82 | 91 | 98 | 96 | 92 | 80 | 64 | 56 |
| Rain (in) | 5.1 | 4.7 | 3.6 | 1.9 | 1.4 | 0.6 | 0.1 | 0.1 | 0.3 | 1.4 | 2.8 | 4.9 |
July is the driest month (0.1 in) and the warmest (highs of 98 °F). 5.1 inches fall in January, the wettest month. Summer highs reach 98 °F, too hot for the outline. The climate in Lake California →
Questions about parks and trails in Lake California
How much of Lake California is conserved land?
under 1% of its land, against a typical 4% for a California State town and 4% nationally (PAD-US). Conserved doesn’t always mean open to visitors: easements are usually private land.
Is there public land near Lake California?
5,587 acres of parks and open public land lie inside Lake California or within 10 miles of it (PAD-US), 3 of them inside the town line.
How much outdoors does Lake California have?
Ahead of 24% of U.S. towns on the Outdoors grade, #728 of 847 in California State. The grade combines the share of land that is conserved, miles of mapped trail per square mile of land, park acres per 1,000 residents and the share of residents within a half mile of a park. It’s a character grade, so it isn’t part of the overall grade. How it works.
Trail talk
Conditions, parking and favorite walks from Lake California neighbors.
Where this page comes from
Conserved and public land: USGS Protected Areas Database of the United States (PAD-US), service updated July 2026. Parks, trails, playgrounds, beaches and other places: OpenStreetMap (© OpenStreetMap contributors, ODbL), map data as of 2026-10-28. Land and water area: Census 2025 Gazetteer. Residents near a park: 2020 Census blocks. National Register: National Park Service. How TownRatings grades the outdoors →