San Tan ValleyAZ
Home to 109,189 people, the city was settled in 2009.
What is it like to live in San Tan Valley?
Where it falls short is cost of living — the typical home is worth about $392K, 4.4 years of the Phoenix metro’s $88K median household income. Health is its strong suit: residents are healthier than 70% of U.S. towns on CDC estimates. Put together, the subjects come to a C+ overall, ranking 63rd of 139 in Arizona. It comes out better than 40% of U.S. towns. No town in Arizona scores lower than San Tan Valley on history. The biggest place to walk is San Tan Mountain Regional Park, 6,630 acres with 20.1 miles of trail. Its midsummer high is 105°F, against 100°F in Arizona’s towns and 85°F across U.S. towns. 39% of the land here is conserved, above both the Arizona town median (14%) and the median of U.S. towns (4.3%).
Figures: health, CDC PLACES · home values, Zillow · incomes, Census ACS, 2020–24 · National Register of Historic Places · OpenStreetMap · NOAA normals, 1991–2020 · USGS PAD-US.
San Tan Valley has grown 23% from 2010 to 2020
81,321 counted in 2010 and 99,894 in 2020.
U.S. Census 2010 & 2020 counts
How San Tan Valley grades
Each subject compared with towns across the country (schools within Arizona), ordered by how far San Tan Valley is from typical.
How TownRatings grades towns →
Moving to San Tan Valley: who provides what
San Tan Valley is unincorporated, so Pinal County and regional agencies provide most services.
EPA SDWIS (Oct 9, 2026) · HIFLD + EIA-861 2025 · Census 2020 ZCTAs · NCES 2024–25 · registration: vote.gov, updated Sep 12, 2025.
The data
Ordered by what stands out in San Tan Valley.
San Tan Valley has a longer frost-free season than nearly all U.S. towns, keeps more of its land conserved than most of Arizona and has home values still below their peak.
San Tan Valley has set aside nearly a third of its land for conservation
Its 18,884 conserved acres are a larger share of the town than in 77% of Arizona towns.
Trails run 73 miles in 21 parks and preserves. San Tan Valley’s trail network density is 1.0 miles per square mile. Parks and preserves locally: 21, covering 6,708 acres.
| Biggest places to walk | Trails | Acres |
|---|---|---|
| 1. San Tan Mountain Regional Park | 20.1 mi | 6,630 |
| 2. Indigo Sky Recreation Facility | 0.3 mi | 5 |
| 3. Rancho Bella Vista South Community Park | — | 26 |
Trails & parks © OpenStreetMap contributors · Conserved land: USGS PAD-US
Public schools in San Tan Valley beat 54% of Arizona districts
Of its 30 schools, three are listed below, each with the reason. The 6 public schools in San Tan Valley teach 5,234 students between them.
| School | Level | Students | Letter |
|---|---|---|---|
| Eduprize SchoolLargest public elementary schoolGrades K–8 | Grades K–8 | 1,733 | A− |
| Poston Butte High SchoolLargest public high schoolGrades 7–12 | Grades 7–12 | 1,310 | C |
| American Leadership Academy San Tan Valley K-6Top results in townGrades K–6 | Grades K–6 | 637 | A− |
NCES · EDFacts · graded within AZ on state tests and graduation
Most working residents commute out of San Tan Valley
San Tan Valley has 6,490 jobs for its 52,309 working residents: even if every job went to a resident, most would still commute out. The average commute takes 36.4 minutes, against 25.4 across Arizona.
San Tan Valley’s median household income comes in at $97,000. For most workers, San Tan Valley is a place to come home to: only 3% work in town. Employers in San Tan Valley added 4,173 jobs between 2013 and 2023, to 6,490. The top destinations are Phoenix (24%), Mesa (14%) and Chandler (10%).
| San Tan Valley | Arizona towns | U.S. towns | |
|---|---|---|---|
| Average trip to work | 36 minutes | 24 minutes | 25 minutes |
| Work from home | 19% | 12% | 11% |
| Median household income | $97,000 | $68,000 | $80,000 |
| Working residents who work in town | 3.4% | 10% | 8% |
Where working residents work
Census LEHD 2023 · ACS
San Tan Valley earns a B+ for health
For adults in San Tan Valley, the share who have diabetes is 9.7%. Against the Arizona average, San Tan Valley comes out ahead on 8 CDC measures out of 32, and behind on 4. Two figures for adults locally: 17% binge drink, 40% sleep under 7 hours.
| San Tan Valley | Arizona towns | U.S. towns | |
|---|---|---|---|
| High blood pressure (CDC PLACES) | 30% | 37% | 35% |
| Binge drink (CDC PLACES) | 17% | 14% | 16% |
| Sleep under 7 hours (CDC PLACES) | 40% | 35% | 36% |
| Yearly checkup (CDC PLACES) | 73% | 75% | 79% |
| What stands out | San Tan Valley | AZ |
|---|---|---|
| Fewer adults with heart disease | 4.7% | 6.4% |
| Fewer older adults who have lost all their teeth | 10.9% | 14.7% |
| More adults with obesity | 37.1% | 31.3% |
CDC PLACES 2025 · modeled estimates for adults · CMS · HRSA
Expect mild winters and hot summers in San Tan Valley
The Florence weather station, 14 miles away, records that the frost-free season runs about 319 days, longer than in 96% of U.S. towns. The Florence weather station, 14 miles away, records that about 169 days a year reach 90°, more than in 99% of U.S. towns.
July afternoons reach 105°, January nights drop to 40° and snow is almost unheard of.
Typical low → high °F
NOAA U.S. Climate Normals, 1991–2020
A younger population than Arizona as a whole
13% of residents are 65 or older in San Tan Valley. College graduates make up 24% of adults 25 and older, against 33% across Arizona. In San Tan Valley, the midpoint age is 34.9 years.
| San Tan Valley | Arizona towns | U.S. towns | |
|---|---|---|---|
| Aged 65 or older | 13% | 22% | 18% |
| Under 18 | 27% | 21% | 22% |
| Median age | 34.9 years | 41.9 years | 40.5 years |
| Bachelor’s degree or more, 25+ | 24% | 24% | 29% |
Ages · share of residents
Education · adults 25 and older
Women and men · all residents
49.8% women, 50.2% men
That’s an even split within the survey’s margin of ±0.9 points. Across Arizona, 50.1% of residents are women. Median age: women 35.5, men 34.4.
| San Tan Valley | AZ | U.S. | |
|---|---|---|---|
| Under 10 | 14.7% | 11.3% | 11.6% |
| 10 to 17 | 12.1% | 10.3% | 10.3% |
| 18 to 24 | 9.3% | 9.4% | 9.1% |
| 25 to 34 | 14.1% | 13.8% | 13.7% |
| 35 to 44 | 16.1% | 12.7% | 13.2% |
| 45 to 54 | 11.5% | 11.6% | 12.2% |
| 55 to 64 | 9.3% | 12% | 12.7% |
| 65 to 74 | 8.6% | 10.8% | 10.2% |
| 75 and older | 4.3% | 8.1% | 7% |
| No diploma | 7.4% | 10.6% | 10.4% |
| High school | 28.7% | 23.5% | 26% |
| Some college | 28.4% | 23.3% | 19.1% |
| Associate’s | 11.6% | 9.3% | 8.8% |
| Bachelor’s | 17.4% | 20.3% | 21.6% |
| Graduate | 6.5% | 13% | 14.1% |
U.S. Census Bureau · ACS 2020-2024 5-year estimates
A typical San Tan Valley home is worth about $393K
The typical value, about $393K, is 17% below its July 2022 peak.
Among 133 Arizona towns, just 9 have a higher going rate for rent than San Tan Valley. The share of households in San Tan Valley who live in a home they own: 82%. Typical home values fell 2.4% in the year to September 2026. Homes sold in San Tan Valley spent a median 78 days on the market.
| San Tan Valley | Arizona towns | U.S. towns | |
|---|---|---|---|
| Median rent | $2,085 a month | $1,190 a month | $1,185 a month |
| Households that own their home | 82% | 76% | 73% |
| Renters paying 30%+ of income on rent | 45% | 46% | 48% |
Typical home value
Census ACS, 2020–24 · Zillow Home Value Index · Redfin Data Center
San Tan Valley faces a moderate natural-hazard risk, led by inland flooding
Expected damage from storms and floods is higher here than in 53% of U.S. communities. 3 flood insurance claims have been paid in San Tan Valley since 2008.
FEMA flood insurance claims · FEMA National Risk Index · OpenFEMA
Mortgage Matchup Center and 46 more within 40 miles
Museums, parks, gardens and other places to visit around San Tan Valley. Close and well known come first.
 35 mi Stadium & arenaMortgage Matchup Center
 35 mi Stadium & arenaChase Field
 27 mi Stadium & arenaMountain America Stadium
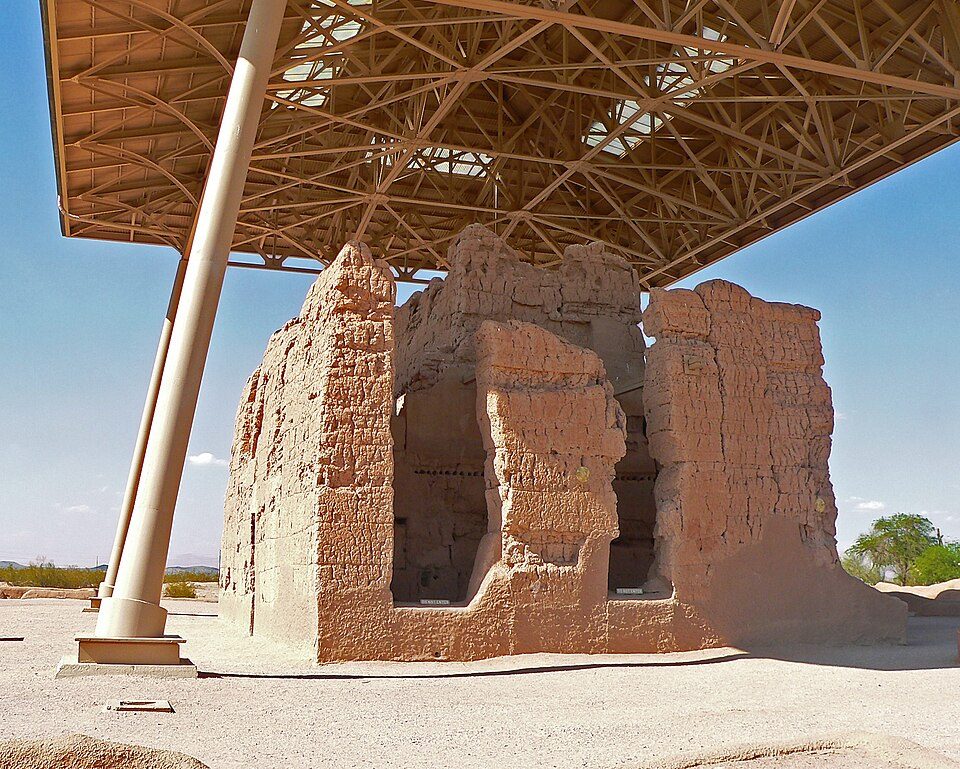 12 mi National MonumentCasa Grande Ruins National Monument88K visitors a year
 27 mi Stadium & arenaMullett Arena
 33 mi MountainCamelback Mountain
Photo credits
Mortgage Matchup Center: Troutfarm27, CC BY-SA 4.0 · Chase Field: U.S. Air Force photo by Staff Sgt. Tyler J. Bolken, Public domain · Mountain America Stadium: Clintus McGintus, CC BY-SA 2.0 · Casa Grande Ruins National Monument: Greg Hume, CC BY-SA 3.0 · Mullett Arena: Kyvuh, CC0 · Camelback Mountain: Dru Bloomfield from Scottsdale, Arizona, USA, CC BY 2.0


Everything we know about San Tan Valley
Colleges nearby
1 within 15 miles of the center of San Tan Valley
About 5 of every 100 San Tan Valley residents are enrolled in college, about the same as Arizona.
97% of working residents leave San Tan Valley for work
Where San Tan Valley’s working residents go each day. Line width shows the share.
Census LEHD 2023
About San Tan Valley
Town in Pinal County, Arizona
San Tan Valley is a town in northern Pinal County, Arizona, United States. The population was 99,894 at the 2020 census. Proposition 495, a measure to incorporate San Tan Valley as a municipality, passed in 2025. It is one of the most recently incorporated cities in the country.
From Wikipedia, licensed CC BY-SA 4.0 · facts via Wikidata (CC0)
- Established
- 2009
- Area
- 37 sq mi
- Elevation
- 1,516 ft
- ZIP code
- 85140, 85143, 85144
- Area code
- 480
San Tan Valley’s neighbors
2 towns share a border with San Tan Valley.
| Town | AZ rank | Overall | Cost | Safety | Schools | Health |
|---|---|---|---|---|---|---|
| San Tan Valley | #63 | C+ | C | — | B− | B+ |
| Queen Creek | #10 | A− | C− | B | A− | A |
| Florence | #33 | B | B− | A− | B− | B− |
San Tan Valley reports no FBI crime data of its own. Compare San Tan Valley with a neighbor →
Questions about San Tan Valley
Short answers, built from the data on this page.
Is San Tan Valley, AZ a good place to live?
San Tan Valley grades C+ overall, better than 40% of U.S. towns and #63 of 139 in Arizona. It grades B+ for health and B− for schools.
Is San Tan Valley, AZ expensive?
Cost of living, which also weighs rents, property taxes and how many households pay 30% or more of their income for housing, grades C.