104 years in pictures
The archive holds 6 old photos and papers going back to 1905.
3 places on the National Register of Historic Places.
- 1922Carnation is settled
Each edition grades its towns against each other only.

A town of 2,471, settled in 1922.
Carnation’s best subject grades are an A+ for health and an A for schools and incomes; its weakest is a D for cost of living. Carnation’s median household income is $153,000, where Washington’s towns sit at $98,000 and U.S. towns at $80,000. On safety, just 6 of Washington’s 141 towns do better. FEMA rates its natural-hazard risk higher than 87% of U.S. communities, with avalanches at the top. Carnation’s trail density is 1.2 miles per square mile, above both the Washington town median (0.8) and the median of U.S. towns (0.4). On the outdoors, just 29 of Washington’s 397 towns do better. Carnation has 3 places on the National Register of Historic Places, among them Andrew and Bergette Hjertoos Farm and David and Martha Entwistles House. Carnation has fewer than 2,500 residents, so it gets subject grades but no overall grade.
Where Carnation beats most towns, and one thing worth knowing.
1,786 counted in 2010 and 2,158 in 2020; an estimated 2,471 in 2025.
U.S. Census 2010 & 2020 counts · Census Bureau estimate, July 1, 2025
Each subject compared with towns across the country (schools within Washington), ordered by how far Carnation is from typical.
How TownRatings grades towns →
The archive holds 6 old photos and papers going back to 1905.
3 places on the National Register of Historic Places.
Museums, parks, gardens and other places to visit around Carnation. Close and well known come first.
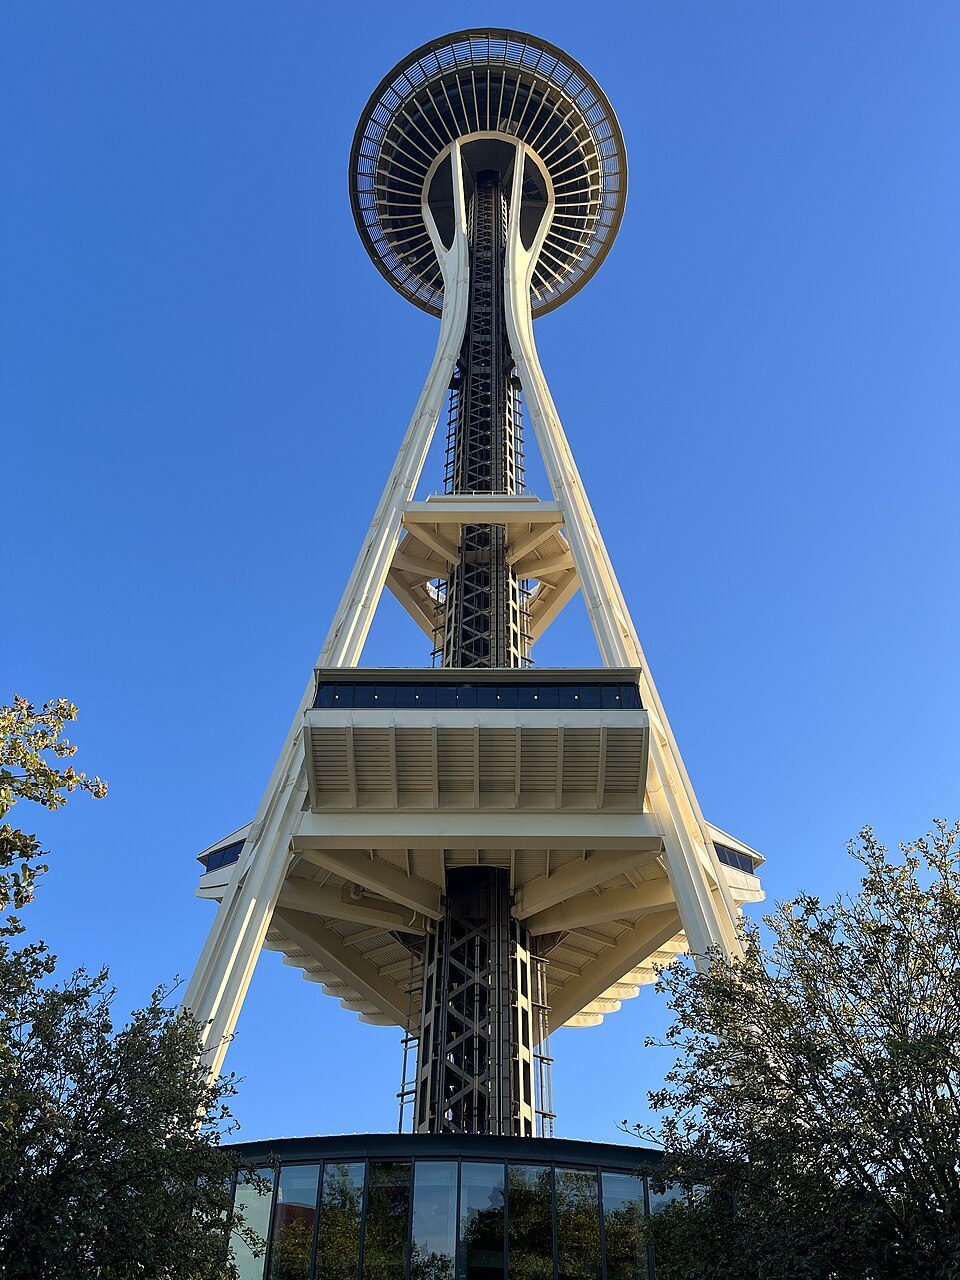
Big draw21 mi LookoutSpace Needle
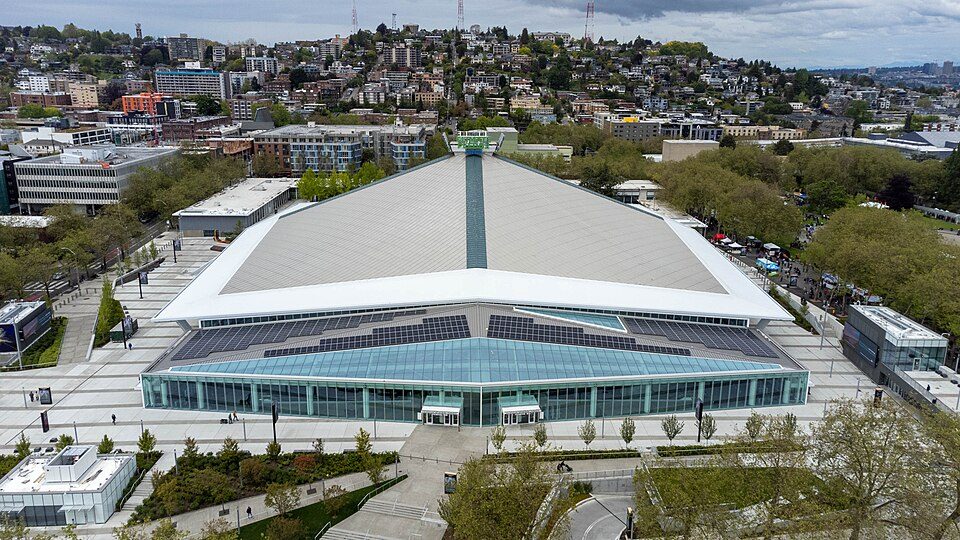
Big draw21 mi Stadium & arenaClimate Pledge Arena
Big draw20 mi Stadium & arenaLumen Field
20 mi Stadium & arenaT-Mobile Park
20 mi Ancient siteSeattle Underground
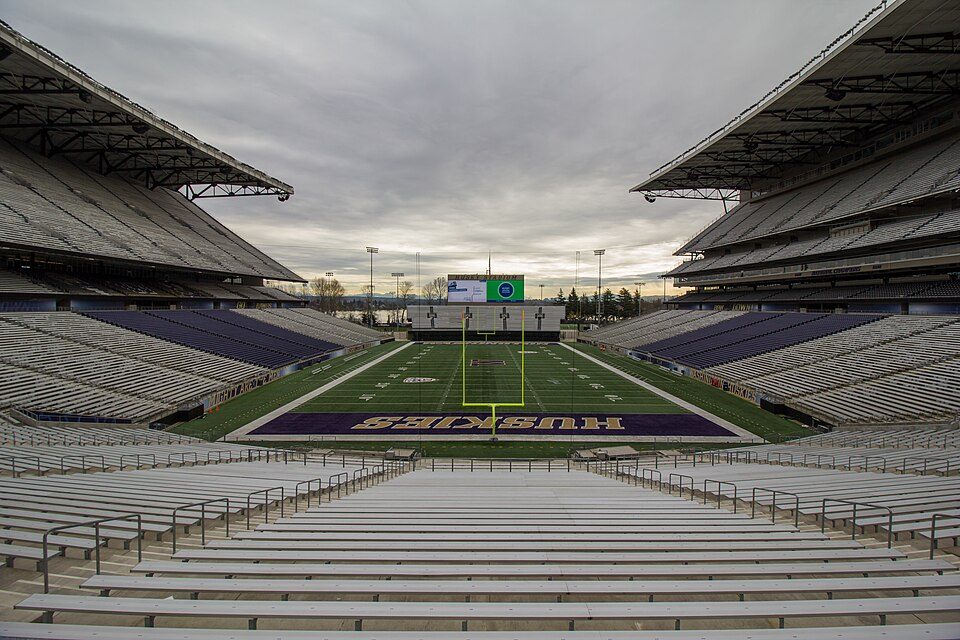
19 mi Stadium & arenaHusky StadiumSpace Needle: Another Believer, CC BY-SA 4.0 · Climate Pledge Arena: Sea Cow, CC BY-SA 4.0 · Lumen Field: "Smart Destinations", GoSeattleCard.com, and Go Seattle Card Blog, CC BY-SA 2.0 · T-Mobile Park: MyName (Cacophony), CC BY-SA 3.0 · Seattle Underground: Mark Hursh, CC BY-SA 3.0 · Husky Stadium: Atomic Taco, CC BY-SA 2.0
Who provides power, water and the rest in Carnation, and how to reach them.
EPA SDWIS (Oct 9, 2026) · HIFLD + EIA-861 2025 · Census 2020 ZCTAs · NCES 2024–25 · registration: vote.gov, updated Sep 30, 2026.
Ordered by what stands out in Carnation.
The typical Carnation home is worth about $968,000, down 1.3% in a year, 65% above the Washington typical home. The median rent in Carnation is $2,175 a month.
| Carnation | Washington towns | U.S. towns | |
|---|---|---|---|
| Median rent | $2,175 a month | $1,739 a month | $1,185 a month |
| Households that own their home | 81% | 71% | 73% |
Census ACS, 2020–24 · Zillow Home Value Index · Redfin Data Center
Its public schools are run by the Riverview School District. Two of its 5 schools are below, each with why it’s listed.
| School | Level | Students | Letter |
|---|---|---|---|
| Tolt Middle SchoolLargest public middle schoolGrades 6–8 | Grades 6–8 | 633 | – |
| ParadeLargest public high schoolGrades PK–12 | Grades PK–12 | 86 | – |
NCES · EDFacts · graded within WA on state tests and graduation
Carnation beats the Washington average on 18 of 31 CDC measures and trails it on 2. 24% of adults have obesity in Carnation.
| Carnation | Washington towns | U.S. towns | |
|---|---|---|---|
| Obesity (CDC PLACES) | 24% | 33% | 35% |
| Diabetes (CDC PLACES) | 6.6% | 9.8% | 12% |
| Get no exercise (CDC PLACES) | 13% | 18% | 25% |
| High blood pressure (CDC PLACES) | 26% | 31% | 35% |
| What stands out | Carnation | WA |
|---|---|---|
| Fewer older adults who have lost all their teeth | 3.7% | 9% |
| Fewer adults with diabetes | 6.6% | 9.5% |
| More binge drinkers | 19.2% | 16.6% |
CDC PLACES 2025 · modeled estimates for adults · CMS · HRSA
Since 1990, 17 flood insurance claims have been paid out in Carnation.
FEMA flood insurance claims · FEMA National Risk Index · OpenFEMA
Carnation’s property crime rate is 2.6 per 1,000 residents. Carnation reports less crime per resident than 80% of the U.S. towns and cities we grade. Carnation’s violent crime rate is 0.4 per 1,000 residents.
| Carnation | Washington towns | U.S. towns | |
|---|---|---|---|
| Property crimes per 1,000 (2025) | 2.6 per 1,000 residents | 15 | 9.9 |
| Violent crimes per 1,000 (2025) | 0.4 per 1,000 residents | 1.5 | 1.6 |
FBI crime data, 2025 · crimes reported to police
1.6% of Carnation residents live below the poverty line. Jobs based in Carnation grew to 365 in 2023, 67 more than in 2013. 28% of Carnation workers work from home.
| Carnation | Washington towns | U.S. towns | |
|---|---|---|---|
| Work from home | 28% | 15% | 11% |
| Below the poverty line | 1.6% | 7.9% | 9.6% |
| Average trip to work | 31 minutes | 27 minutes | 25 minutes |
| Working residents who work in town | 1.6% | 4.9% | 8% |
Census LEHD 2023 · ACS
Carnation has mild winters and pleasant summers, with plenty of rain. July afternoons reach 76°, January nights drop to 35° and about 4 inches of snow falls in a winter.
NOAA U.S. Climate Normals, 1991–2020
People 65 and older are 9% of residents (17% statewide); children under 18 are 29% of residents (21% statewide). Carnation has grown 15% since 2020, to 2,471 residents in the Census Bureau’s 2025 estimate. 48% of adults 25 and older have a bachelor’s degree or more, vs 40% across Washington.
| Carnation | Washington towns | U.S. towns | |
|---|---|---|---|
| Aged 65 or older | 8.6% | 16% | 18% |
| Under 18 | 28% | 22% | 22% |
| Bachelor’s degree or more, 25+ | 48% | 30% | 29% |
| Median age | 36.8 years | 38.5 years | 40.5 years |
53% women, 47% men
About 90 men for every 100 women (the survey’s margin: ±2.6 points). Across Washington, 49.6% of residents are women.
| Carnation | WA | U.S. | |
|---|---|---|---|
| Under 10 | 13.4% | 11.5% | 11.6% |
| 10 to 17 | 15.1% | 9.9% | 10.3% |
| 18 to 24 | 7.1% | 8.5% | 9.1% |
| 25 to 34 | 12.5% | 15.2% | 13.7% |
| 35 to 44 | 16% | 14.3% | 13.2% |
| 45 to 54 | 15.8% | 12% | 12.2% |
| 55 to 64 | 11.5% | 12% | 12.7% |
| 65 to 74 | 7.6% | 10.1% | 10.2% |
| 75 and older | 1% | 6.5% | 7% |
| No diploma | 5.6% | 7.7% | 10.4% |
| High school | 19.6% | 21.6% | 26% |
| Some college | 19.3% | 21% | 19.1% |
| Associate’s | 7.6% | 10% | 8.8% |
| Bachelor’s | 28.7% | 24% | 21.6% |
| Graduate | 19.2% | 15.6% | 14.1% |
Census population estimates, 2025 · U.S. Census Bureau · ACS 2020-2024 5-year estimates · in a town of 2,500, single groups can be off by several points
1.4 miles of trail in 3 parks and preserves. The biggest park or preserve is Tolt-MacDonald Park, at 34 acres.
| Biggest places to walk | Trails | Acres |
|---|---|---|
| 1. Tolt-MacDonald Park | 0.3 mi | 34 |
| 2. Nick Loutsis Park | 0.1 mi | 8 |
| 3. Valley Memorial Park | — | 7 |
Trails & parks © OpenStreetMap contributors · Conserved land: USGS PAD-US
5 within 15 miles of the center of Carnation
About 7 of every 100 Carnation residents are enrolled in college, about the same as Washington.
Where Carnation’s working residents go each day. Line width shows the share.
Census LEHD 2023
3 places in Carnation on the National Register of Historic Places.
City in Washington, United States
Carnation (Lushootseed: tultxʷ) is a city in King County, Washington, United States. It was historically known as Tolt and lies at the confluence of the Snoqualmie and Tolt rivers. The city is located east of Sammamish and south of Duvall on State Route 203. The population was 2,158 at the 2020 census. Prior to American settlement, the area was occupied by a large village of the Snoqualmie Tribe. It was the center of Snoqualmie society in the 19th century. After their removal to reservations, the city was resettled by Americans, who founded the city of Tolt in 1865. It became a thriving dairy town in the 20th century, eventually being renamed to Carnation in honor of the Carnation Evaporate…
From Wikipedia, licensed CC BY-SA 4.0 · facts via Wikidata (CC0)
Short answers, built from the data on this page.
Yes. That is 8.4 years of the area's median household income ($115,177 across the Seattle-Tacoma-Bellevue, WA metro area). Cost of living, which also weighs rents, property taxes and how many households pay 30% or more of their income for housing, grades D.