Hybla Valley in pictures
Census counts: 15,533 in 1980, 16,319 in 2020. The archive holds 30 old photos and papers going back to 2009 and 3 maps from 1944 on.
1 place on the National Register of Historic Places.
Explore the history →Each edition grades its towns against each other only.
A town of 17,257.
Hybla Valley's standout: it is easier to get around on foot or by transit than 98% of U.S. towns. Overall it grades B, 163rd among Virginia's 249 graded towns. 10% of its land is conserved. 46% of households own their home in Hybla Valley, where Virginia’s towns sit at 68% and U.S. towns at 73%. The biggest park or preserve is Little Hunting Creek Park, at 23 acres. Hybla Valley has 1 place on the National Register.
Where Hybla Valley beats most towns.
| School | Grades | Students |
|---|---|---|
| Hybla Valley Elementary | PK–6 | 878 |
| St. Louis Catholic School | PK–8 | 510 |
| Bryant High | 9–12 | 154 |
Where Hybla Valley’s working residents go each day. Line width shows the share.
Census LEHD 2023
Each subject compared with towns across the country (schools within Virginia), ordered by how far Hybla Valley is from typical.
How TownRatings grades towns →
Census counts: 15,533 in 1980, 16,319 in 2020. The archive holds 30 old photos and papers going back to 2009 and 3 maps from 1944 on.
1 place on the National Register of Historic Places.
Explore the history →Museums, parks, gardens and other places to visit around Hybla Valley. Close and well known come first.
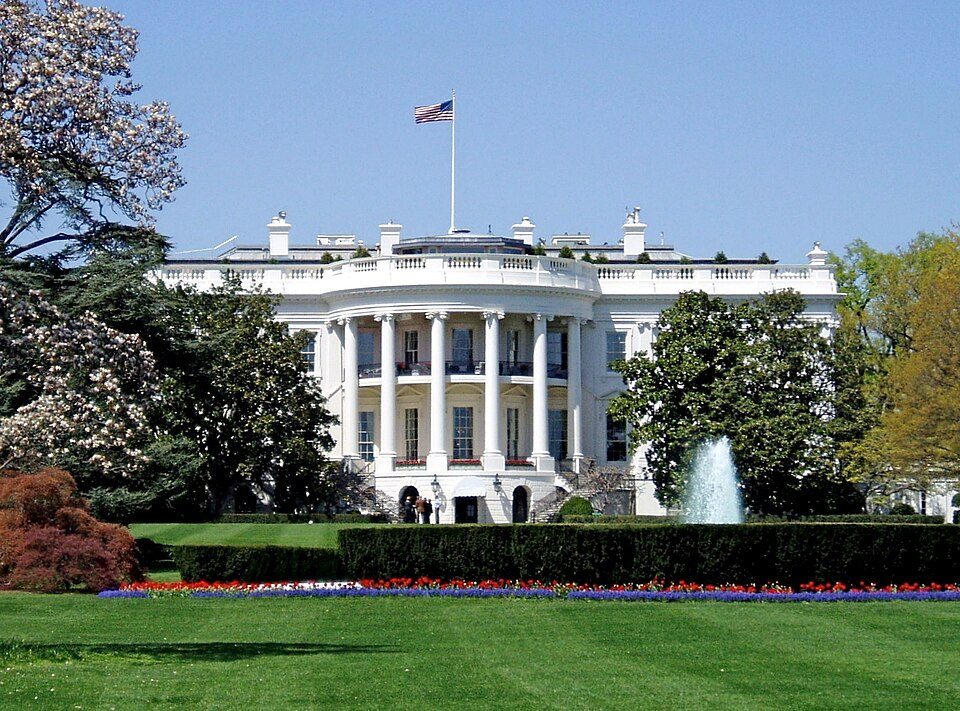
Big draw11 mi National park siteWhite House311K visitors a year
Big draw10 mi National MemorialWashington Monument204K visitors a year
Big draw9 mi LandmarkArlington National Cemetery
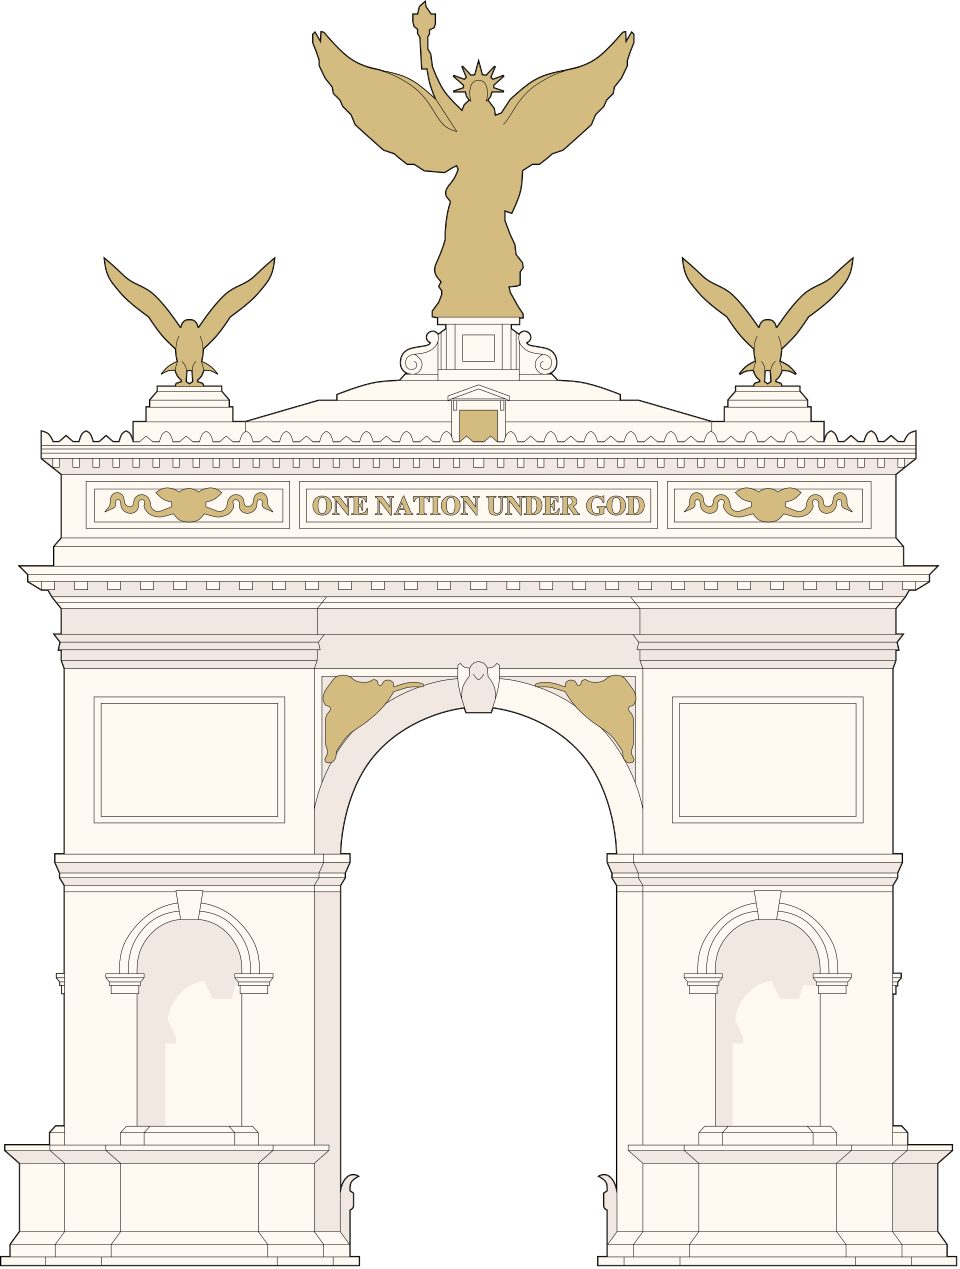
Big draw10 mi LandmarkUnited States Triumphal Arch
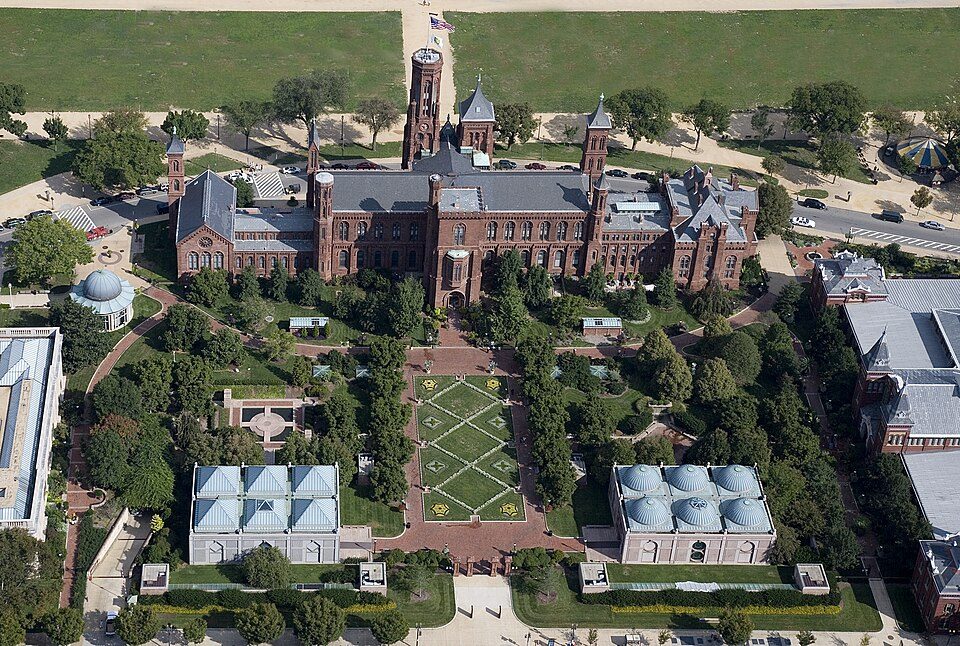
Big draw10 mi MuseumSmithsonian Institution30.0M visitors a year
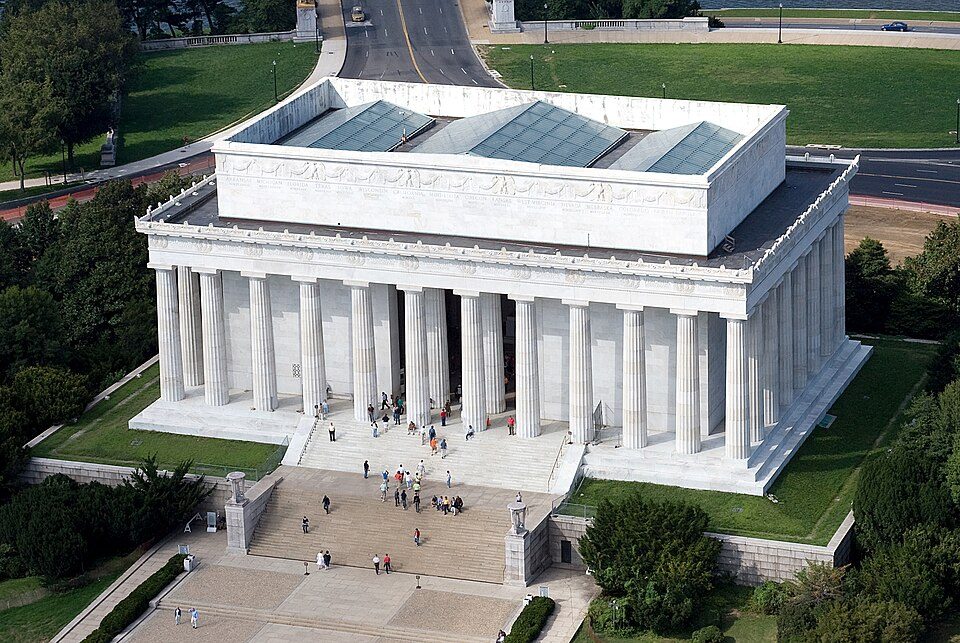
Big draw10 mi National MemorialLincoln Memorial7.7M visitors a yearWhite House: This image or media was taken or created by Matt H. Wade. To see his entire port, CC BY-SA 3.0 · Washington Monument: Oren Rozen, CC BY-SA 4.0 · Arlington National Cemetery: Protoant, Public domain · United States Triumphal Arch: Hstoops, CC0 · Smithsonian Institution: Highsmith, Carol M., 1946-, photographer, Public domain · Lincoln Memorial: Aerial_view_of_Lincoln_Memorial_-_east_side.jpg: Carol M. Highsmith derivative w, Public domain
Hybla Valley is unincorporated, so Fairfax County and regional agencies provide most services.
EPA SDWIS (Oct 9, 2026) · HIFLD + EIA-861 2025 · Census 2020 ZCTAs · NCES 2024–25 · registration: vote.gov, updated Sep 30, 2026.
Ordered by what stands out in Hybla Valley.
Hybla Valley is mostly renters, but it scores below Woodlawn and its other neighbors on health and has property taxes about twice the Virginia norm.
Most working residents leave Hybla Valley for work: only 4% work in town. Hybla Valley’s average trip to work is 32 minutes. Jobs based in Hybla Valley grew to 4,579 in 2023, 701 more than in 2013.
| Hybla Valley | Virginia towns | U.S. towns | |
|---|---|---|---|
| Average trip to work | 32 minutes | 27 minutes | 25 minutes |
| Work from home | 13% | 18% | 11% |
| Median household income | $81,000 | $102,000 | $80,000 |
| Working residents who work in town | 3.5% | 5% | 8% |
Census LEHD 2023 · ACS
Its public schools are run by the Fairfax County Public Schools. Two of its 6 schools are below, each with why it’s listed.
| School | Level | Students | Letter |
|---|---|---|---|
| Hybla Valley ElementaryLargest public elementary schoolGrades PK–6 | Grades PK–6 | 878 | D− |
| Bryant HighLargest public high schoolGrades 9–12 | Grades 9–12 | 154 | C− |
NCES · EDFacts · graded within VA on state tests and graduation
Hybla Valley has chilly winters and warm summers. The July high in Hybla Valley is 89°F.
NOAA U.S. Climate Normals, 1991–2020
0.9 miles of trail in 10 parks and preserves.
| Hybla Valley | Virginia towns | U.S. towns | |
|---|---|---|---|
| Conserved land | 9.7% | 4.6% | 4.3% |
| Miles of trail per square mile | 0.4 miles per square mile | 0.7 | 0.4 |
| Biggest places to walk | Trails | Acres |
|---|---|---|
| 1. Little Hunting Creek Park | 0.2 mi | 23 |
| 2. Williamsburg Manor Park | 0.1 mi | 22 |
| 3. Martin Luther King Junior Park | 0.1 mi | 21 |
Trails & parks © OpenStreetMap contributors · Conserved land: USGS PAD-US
All 4 graded neighbors score healthier than its C+, from Woodlawn (B−) to Fort Hunt (A+).
Hybla Valley beats the Virginia average on 2 of 32 CDC measures and trails it on 14. 17% of adults 18 to 64 have no health insurance in Hybla Valley. Only 10 of the 253 Virginia towns we compare have a higher share of adults who worry about having enough food than Hybla Valley.
| Hybla Valley | Virginia towns | U.S. towns | |
|---|---|---|---|
| No health insurance, 18–64 (CDC PLACES) | 17% | 8.4% | 8.1% |
| Food insecurity (CDC PLACES) | 25% | 12% | 14% |
| Sleep under 7 hours (CDC PLACES) | 42% | 36% | 36% |
| Binge drink (CDC PLACES) | 13% | 14% | 16% |
| What stands out | Hybla Valley | VA |
|---|---|---|
| Fewer adults who have had cancer | 5.4% | 7.7% |
| Fewer adults with arthritis | 22.8% | 26.2% |
| More uninsured adults | 17% | 8.7% |
CDC PLACES 2025 · modeled estimates for adults · CMS · HRSA
Only 45.6% of households own their home, against 67.3% across Virginia.
No broad age group is more than 4 points off the Virginia average. 14% of Hybla Valley residents are 65 or older. 36% of adults 25 and older have a bachelor’s degree or more, vs 42% across Virginia.
| Hybla Valley | Virginia towns | U.S. towns | |
|---|---|---|---|
| Median age | 35.2 years | 38.5 years | 40.5 years |
| Under 18 | 25% | 23% | 22% |
| Aged 65 or older | 14% | 16% | 18% |
| Bachelor’s degree or more, 25+ | 36% | 44% | 29% |
55% women, 45% men
About 84 men for every 100 women (the survey’s margin: ±3.6 points). Across Virginia, 50.6% of residents are women.
| Hybla Valley | VA | U.S. | |
|---|---|---|---|
| Under 10 | 15.6% | 11.6% | 11.6% |
| 10 to 17 | 9.5% | 10.1% | 10.3% |
| 18 to 24 | 10.8% | 9.3% | 9.1% |
| 25 to 34 | 13.7% | 13.5% | 13.7% |
| 35 to 44 | 12.2% | 13.6% | 13.2% |
| 45 to 54 | 10.6% | 12.5% | 12.2% |
| 55 to 64 | 13.8% | 12.8% | 12.7% |
| 65 to 74 | 9.2% | 9.9% | 10.2% |
| 75 and older | 4.6% | 6.8% | 7% |
| No diploma | 17.8% | 8.4% | 10.4% |
| High school | 29.6% | 23.9% | 26% |
| Some college | 10.9% | 17.7% | 19.1% |
| Associate’s | 5.8% | 7.8% | 8.8% |
| Bachelor’s | 18.3% | 23.7% | 21.6% |
| Graduate | 17.5% | 18.5% | 14.1% |
U.S. Census Bureau · ACS 2020-2024 5-year estimates
The median property tax bill is $5,963, against $2,790 across Virginia, another input to its cost-of-living grade.
The median sale price was $663,000 in May 2026.
Zillow Home Value Index · Redfin Data Center
Expected storm and flood damage is higher than in 50% of U.S. communities. One flood insurance claim has been paid in Hybla Valley since 1978.
FEMA flood insurance claims · FEMA National Risk Index · OpenFEMA
32 within 15 miles of the center of Hybla Valley
About 6 of every 100 Hybla Valley residents are enrolled in college, about the same as Virginia.
Census-designated place in Virginia, United States
Hybla Valley () is a census-designated place (CDP) in Fairfax County, Virginia, United States, south of Alexandria. The population was 15,801 at the 2010 census, down from 16,721 in 2000 due to a reduction in area, resulting from some of the eastward neighborhoods including much of Hollin Hills being moved to the Fort Hunt CDP. The population increased to 16,319 in the 2020 census.
From Wikipedia, licensed CC BY-SA 4.0 · facts via Wikidata (CC0)
4 towns share a border with Hybla Valley.
All 4 graded towns on its borders grade higher than its B; Groveton (B+) is closest.
| Town | VA rank | Overall | Cost | Safety | Schools | Health |
|---|---|---|---|---|---|---|
| Hybla Valley | #163 | B | C | — | B+ | C+ |
| Mount Vernon | #64 | A | C− | — | B+ | A |
| Fort Hunt | #80 | A | D | — | B+ | A+ |
| Woodlawn | #114 | B+ | C+ | — | B+ | B− |
| Groveton | #133 | B+ | C− | — | B+ | B+ |
Hybla Valley, Mount Vernon, Fort Hunt, Woodlawn and Groveton report no FBI crime data of their own. Compare Hybla Valley with a neighbor →
Short answers, built from the data on this page.
By most measures, yes. Hybla Valley grades B overall, better than 57% of U.S. towns and #163 of 249 in Virginia. It grades C+ for health and B+ for schools.
The typical home is worth about $503,000, 22% above the Virginia typical home. Cost of living, which also weighs rents, property taxes and how many households pay 30% or more of their income for housing, grades C.