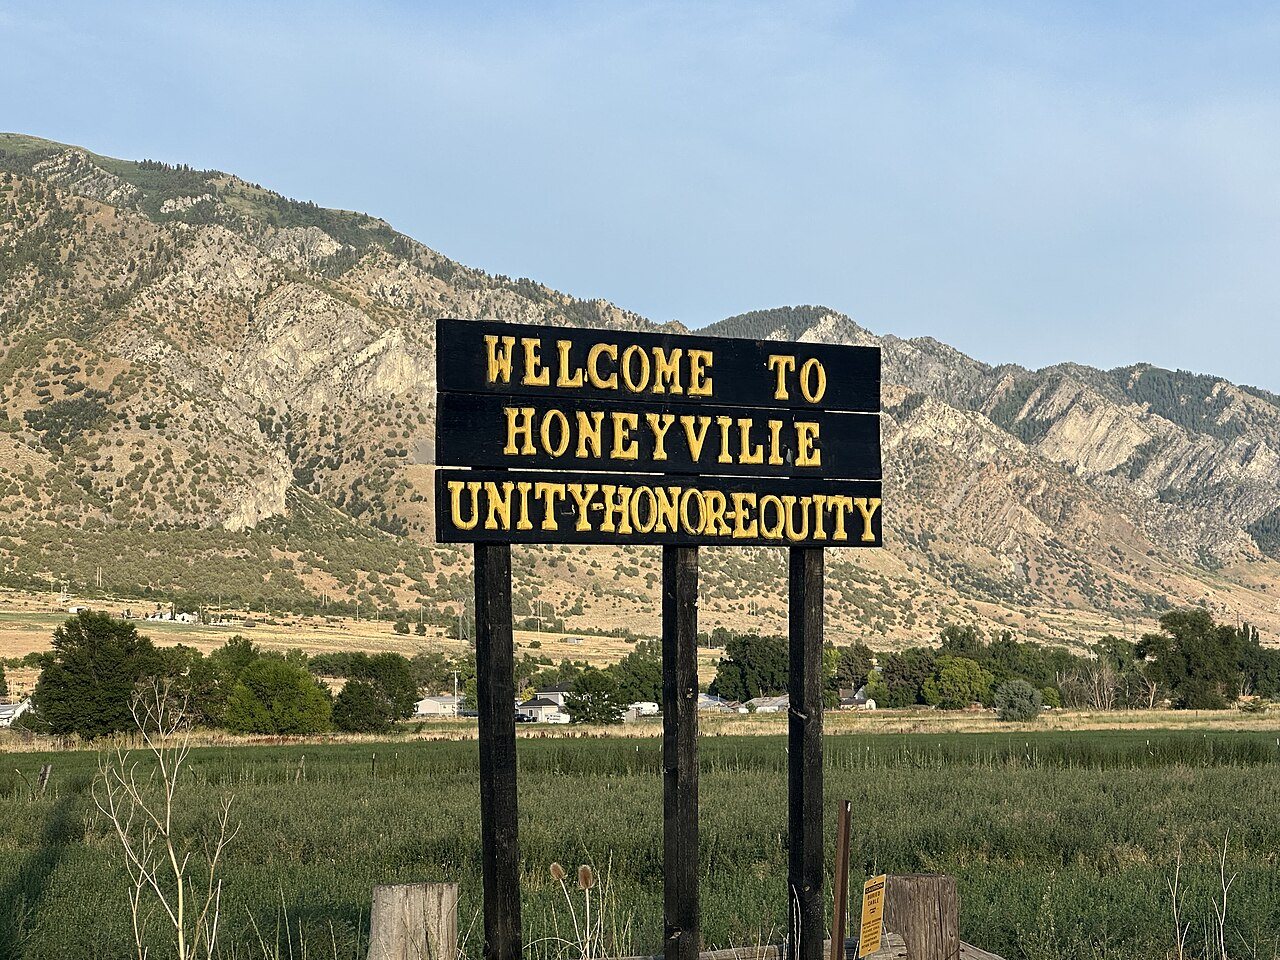
Honeyville Utah Welcome Sign, 2025
Honeyville’s story
165 years in pictures
The archive holds 1 old photo or paper going back to 2025.
- 1861Honeyville is settled
Each edition grades its towns against each other only.

A town of 1,806, settled in 1861.
The best of Honeyville’s subject grades are a B+ for incomes and health. Only 2 of the 120 Utah towns we compare have a lower share of working residents who work in town than Honeyville. Uinta-Wasatch-Cache National Forest, at 983 acres with 1.4 miles of trail, is the biggest park or preserve. Honeyville has fewer than 2,500 residents, so it gets subject grades but no overall grade.
1,441 counted in 2010 and 1,606 in 2020; an estimated 1,806 in 2025.
U.S. Census 2010 & 2020 counts · Census Bureau estimate, July 1, 2025
Each subject compared with towns across the country (schools within Utah), ordered by how far Honeyville is from typical.
How TownRatings grades towns →
The archive holds 1 old photo or paper going back to 2025.
Who provides power, water and the rest in Honeyville, and how to reach them.
EPA SDWIS (Oct 9, 2026) · HIFLD + EIA-861 2025 · Census 2020 ZCTAs · NCES 2024–25 · registration: vote.gov, updated Mar 13, 2026.
Ordered by what stands out in Honeyville.
Adults 18 to 34 are 13% of residents (26% statewide); people 65 and older are 19% of residents (12% statewide). 30% of residents are under 18 in Honeyville, against 30% in Utah’s towns and 22% across U.S. towns. Honeyville has grown 13% since 2020, to 1,806 residents in the Census Bureau’s 2025 estimate.
| Honeyville | Utah towns | U.S. towns | |
|---|---|---|---|
| Under 18 | 30% | 30% | 22% |
| Median age | 41.5 years | 32.6 years | 40.5 years |
| Aged 65 or older | 19% | 11% | 18% |
| Bachelor’s degree or more, 25+ | 31% | 36% | 29% |
47% women, 53% men
That’s an even split within the survey’s margin of ±6.2 points. Across Utah, 49.3% of residents are women.
| Honeyville | UT | U.S. | |
|---|---|---|---|
| Under 10 | 14.4% | 14.6% | 11.6% |
| 10 to 17 | 15.7% | 13.2% | 10.3% |
| 18 to 24 | 3.2% | 11.6% | 9.1% |
| 25 to 34 | 9.4% | 14.8% | 13.7% |
| 35 to 44 | 11.2% | 13.8% | 13.2% |
| 45 to 54 | 15.1% | 11% | 12.2% |
| 55 to 64 | 12.5% | 9.1% | 12.7% |
| 65 to 74 | 14.5% | 7.3% | 10.2% |
| 75 and older | 4% | 4.6% | 7% |
| No diploma | 6.2% | 6.6% | 10.4% |
| High school | 28.7% | 22.3% | 26% |
| Some college | 25.5% | 23.5% | 19.1% |
| Associate’s | 8.2% | 9.9% | 8.8% |
| Bachelor’s | 21.8% | 24.7% | 21.6% |
| Graduate | 9.5% | 13% | 14.1% |
Census population estimates, 2025 · U.S. Census Bureau · ACS 2020-2024 5-year estimates · in a town of 1,800, single groups can be off by several points
Most working residents leave Honeyville for work: only 1% work in town. Since 2013, Honeyville has added 57 jobs, to 181 in 2023. 3.5% of residents live below the poverty line in Honeyville, where Utah’s towns sit at 6.2% and U.S. towns at 9.6%.
| Honeyville | Utah towns | U.S. towns | |
|---|---|---|---|
| Below the poverty line | 3.5% | 6.2% | 9.6% |
| Median household income | $87,000 | $101,000 | $80,000 |
| Average trip to work | 23 minutes | 22 minutes | 25 minutes |
Census LEHD 2023 · ACS
Honeyville beats the Utah average on 2 of 32 CDC measures and trails it on 10. 75% of adults had a checkup this year in Honeyville. Among 119 Utah towns, just 9 have a higher share of adults who sleep under 7 hours than Honeyville.
| Honeyville | Utah towns | U.S. towns | |
|---|---|---|---|
| Binge drink (CDC PLACES) | 10% | 11% | 16% |
| Yearly checkup (CDC PLACES) | 75% | 72% | 79% |
| Frequent physical distress (CDC PLACES) | 15% | 12% | 14% |
| Sleep under 7 hours (CDC PLACES) | 38% | 34% | 36% |
| What stands out | Honeyville | UT |
|---|---|---|
| More adults treating high blood pressure | 71.6% | 65.6% |
| More adults getting a yearly checkup | 75% | 70.4% |
| More adults with COPD | 6.6% | 4.6% |
CDC PLACES 2025 · modeled estimates for adults · CMS · HRSA
Honeyville has chilly, snowy winters and warm summers, with very little rain. Honeyville’s July high is 91°F.
NOAA U.S. Climate Normals, 1991–2020
Expected storm and flood damage is lower than in 61% of U.S. communities.
FEMA National Risk Index · OpenFEMA
4.3 miles of trail in 2 parks and preserves. The trail density in Honeyville is 0.4 miles per square mile.
| Honeyville | Utah towns | U.S. towns | |
|---|---|---|---|
| Miles of trail per square mile | 0.4 miles per square mile | 1.1 | 0.4 |
| Conserved land | 5.5% | 3.4% | 4.3% |
| Biggest places to walk | Trails | Acres |
|---|---|---|
| 1. Uinta-Wasatch-Cache National Forest | 1.4 mi | 983 |
| 2. Coldwater Canyon Wildlife Managment Area | 0.8 mi | 162 |
Trails & parks © OpenStreetMap contributors · Conserved land: USGS PAD-US
The typical Honeyville home is worth about $537,000, up 1.5% in a year, close to the Utah typical home. 88% of Honeyville households own their home.
| Honeyville | Utah towns | U.S. towns | |
|---|---|---|---|
| Households that own their home | 88% | 79% | 73% |
| Median rent | $1,325 a month | $1,538 a month | $1,185 a month |
Census ACS, 2020–24 · Zillow Home Value Index · Redfin Data Center
Museums, parks, gardens and other places to visit around Honeyville. Close and well known come first.
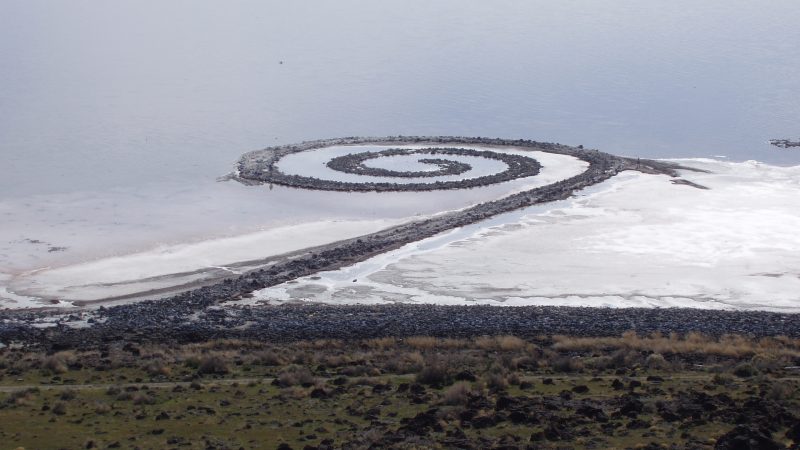 33 mi LandmarkSpiral Jetty
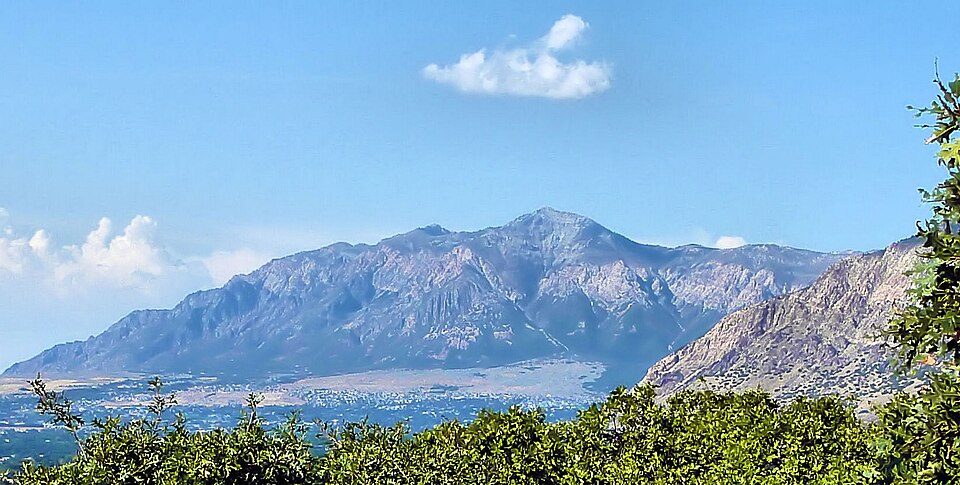 20 mi MountainBen Lomond Mountain32 mi Ski areaSnowbasin Resort157 runs · 3,000 ft vertical
 19 mi National Historical ParkGolden Spike National Historical Park54K visitors a year25 mi Ski areaPowder Mountain Ski Resort155 runs · 2,755 ft vertical
 33 mi MuseumHill Aerospace Museum180K visitors a year
Spiral Jetty: Sculpture: Robert Smithson 1938-1973Image:Soren.harward at en.wikipedia, Public domain · Ben Lomond Mountain: Joe Tordiff, CC BY-SA 2.0 · Golden Spike National Historical Park: Unknown, Public domain · Hill Aerospace Museum: User:Jaydec, CC BY-SA 3.0
None within 15 miles of Honeyville; the nearest are
About 4 of every 100 Honeyville residents are enrolled in college, against 8 across Utah.
Where Honeyville’s working residents go each day. Line width shows the share.
Census LEHD 2023
City in Utah, United States
Honeyville is a city near the eastern edge of Box Elder County, Utah, United States. The population was 1,606 as of the 2020 census.
From Wikipedia, licensed CC BY-SA 4.0 · facts via Wikidata (CC0)
3 towns share a border with Honeyville.
| Town | UT rank | Overall | Cost | Safety | Schools | Health |
|---|---|---|---|---|---|---|
| Honeyville | — | — | B− | — | B− | B+ |
| Bear River City | — | — | — | — | — | — |
| Elwood | — | — | C+ | — | B− | B+ |
| Deweyville | — | — | — | — | — | — |
Honeyville and Elwood have fewer than 2,500 residents, so they get subject grades but no overall grade. Honeyville and Elwood report no FBI crime data of their own. Bear River City and Deweyville aren’t graded (fewer than 1,000 residents, or not enough data). Compare Honeyville with a neighbor →
Short answers, built from the data on this page.
That is 6.4 years of the area's median household income ($83,616 across the Brigham City, UT-ID area). Cost of living, which also weighs rents, property taxes and how many households pay 30% or more of their income for housing, grades B−.


