






Heath Mount Primary School
Birmingham, B12 9SR · Birmingham local authority
Birmingham’s School Grade B better than 55% of towns in England
What stands out about Heath Mount Primary School
- Its own letter, C−: Key Stage 2 results better than 20% of England’s primary schools
- 51% meet the expected standard in reading, writing and maths, 11 points below England’s schools
- Room to spare: 290 pupils for 420 places
- 57% of pupils are eligible for free school meals (more than England’s 25%)
- Ofsted report card, April 2026: achievement expected standard, safeguarding met (shown, not graded)
- Every family who put it first got a place for September 2026 (13 of 13)
- Homes in its postcode sector (B12 9) sold for a median £240,500; Birmingham’s is £225,000
Results
DfE · Key Stage 2Reading, writing and maths 51%
Met the expected standard, DfE’s 3-year average 2023–2025 · higher than 20% of England’s 14,979 graded primaries · Birmingham avg 62%
Each subject, 2025
Met the expected standard; the mark is England’s schools · average scaled score: reading 103, maths 105 (100 = the expected standard)
Disadvantaged pupils, 2025
Met the expected standard in reading, writing and maths: the 37 disadvantaged pupils and the rest, beside England’s schools
England’s figures are of its graded mainstream state schools, each school counted once; grammar schools are included, which is why the right-hand tail is long. Small cohorts are suppressed.
How hard is it to get a place at Heath Mount Primary School?
Every family who put it first got a place for September 2026.
In every year shown, every family who put it first was offered a place. The council runs the coordinated admissions; each school’s rules (siblings, distance, faith) decide who gets in. DfE doesn’t publish the furthest distance offered, so check the council’s admissions booklet for that. Excelsior Multi Academy Trust sets the admissions rules. Apply through Birmingham council’s coordinated admissions.
Outline = places offered · green = families who put it first · striped = more first choices than places · the 10 most in demand
100% got their first choice
Birmingham and Birmingham, side by side
2023–2025All 271 graded primaries in Birmingham. Schools with more pupils on free school meals usually score lower, so a school above the crowd for its free school meals is doing better than its intake predicts. Birmingham’s schools are coloured by their letter.
Show as a table
| School | Letter | Free school meals | KS2 expected standard |
|---|---|---|---|
| Cromwell Junior and Infant School | A+ | 77% | 92% |
| Little Sutton Primary School | A+ | 6% | 91% |
| Four Oaks Primary School | A+ | 8% | 91% |
| St James Catholic Primary School | A+ | 20% | 91% |
| The Olive School, Small Heath | A+ | 41% | 91% |
| Lift Lea Forest | A+ | 68% | 88% |
| Lift Montgomery | A+ | 61% | 87% |
| The Olive School, Birmingham | A+ | 46% | 87% |
| Lift Percy Shurmer | A+ | 73% | 86% |
| Coppice Primary School | A+ | 8% | 85% |
| The Shirestone Academy | A+ | 61% | 84% |
| St Joseph's Catholic Primary School | A+ | 17% | 84% |
| Moor Hall Primary School | A+ | 7% | 83% |
| St Matthew's CofE Primary School | A+ | 74% | 83% |
| Ark Victoria Academy | A+ | 69% | 83% |
| St Peter's Catholic Primary School | A+ | 36% | 83% |
| Chilcote Primary School | A | 22% | 81% |
| Wylde Green Primary School | A | 30% | 81% |
| Penns Primary School | A | 17% | 81% |
| St Mary's Catholic Primary School | A | 20% | 81% |
| Whitehouse Common Primary School | A | 9% | 80% |
| The Deanery Church of England Primary School | A | 7% | 80% |
| Barr View Primary & Nursery Academy | A | 30% | 80% |
| St Ambrose Barlow Catholic Primary School | A | 28% | 80% |
| Christ The King Catholic Primary School | A | 45% | 79% |
| Nishkam Primary School Birmingham | A | 13% | 79% |
| Hall Green Junior School | A | 38% | 78% |
| Arden Primary School | A | 60% | 78% |
| Water Mill Primary School | A | 43% | 78% |
| St Catherine of Siena Catholic Primary School | A | 35% | 78% |
| St Alban's Catholic Primary School | A | 33% | 78% |
| Walmley Junior School | A | 17% | 78% |
| Ark Tindal Primary Academy | A | 58% | 77% |
| Moor Green Primary Academy | A | 28% | 77% |
| Merritts Brook Primary E-ACT Academy | A | 68% | 77% |
| Hill West Primary School | A | 17% | 77% |
| Our Lady of Fatima Catholic Primary School | A | 18% | 77% |
| Maney Hill Primary School | A | 6% | 76% |
| St Dunstan's Catholic Primary School | A | 37% | 76% |
| Al-Furqan Primary School | A | 49% | 76% |
| Starbank School | A | 48% | 76% |
| Story Wood School | A | 48% | 76% |
| Colmore Junior School | A− | 27% | 75% |
| Ark Kings Academy | A− | 70% | 75% |
| Holy Cross Catholic Primary School | A− | 8% | 75% |
| Prince Albert Junior and Infant School | A− | 54% | 75% |
| Chad Vale Primary School | A− | 20% | 74% |
| Moseley Church of England Primary School | A− | 18% | 74% |
| St Mary's Church of England Primary School | A− | 26% | 74% |
| St Anne's Catholic Primary School | A− | 68% | 74% |
| St Gerard's Catholic Primary School | A− | 47% | 74% |
| St Brigid's Catholic Primary School | A− | 33% | 74% |
| Bordesley Village Primary School | A− | 60% | 74% |
| Oasis Academy Hobmoor | A− | 61% | 73% |
| Twickenham Primary School | A− | 55% | 73% |
| Heathfield Primary School | A− | 57% | 73% |
| Princethorpe Junior School | A− | 72% | 73% |
| Corpus Christi Catholic Primary School | A− | 60% | 72% |
| St Bernard's Catholic Primary School | A− | 38% | 72% |
| St Jude's Catholic Primary School | A− | 64% | 72% |
| Slade Primary School | A− | 48% | 72% |
| Billesley Primary School | A− | 49% | 72% |
| Oasis Academy Short Heath | A− | 56% | 72% |
| Canterbury Cross Primary School | A− | 57% | 72% |
| Bells Farm Primary School | A− | 42% | 71% |
| Our Lady of Lourdes Catholic Primary School | A− | 28% | 71% |
| St Peters CofE Primary School | A− | 21% | 71% |
| St Michael's CofE Primary Academy, Handsworth | A− | 58% | 71% |
| Oasis Academy Boulton | A− | 59% | 71% |
| Northfield Manor Primary Academy | A− | 48% | 71% |
| Shaw Hill Primary School | B+ | 58% | 70% |
| Lozells Junior and Infant School and Nursery | B+ | 67% | 70% |
| Nelson Primary School | B+ | 46% | 70% |
| Stirchley Primary School | B+ | 33% | 70% |
| Quinton Church Primary School | B+ | 17% | 70% |
| St Augustine's Catholic Primary School | B+ | 46% | 70% |
| Gilbertstone Primary School | B+ | 39% | 69% |
| Hawthorn Primary School | B+ | 62% | 69% |
| Dorrington Academy | B+ | 36% | 69% |
| Greenholm Primary School | B+ | 37% | 69% |
| St Columba's Catholic Primary School | B+ | 46% | 69% |
| Aston Tower Community Primary School | B+ | 64% | 69% |
| Abbey Catholic Primary School | B+ | 42% | 69% |
| New Oscott Primary School | B+ | 18% | 69% |
| Adderley Primary School | B+ | 63% | 68% |
| Minworth Junior and Infant School | B+ | 48% | 68% |
| Nansen Primary School | B+ | 53% | 68% |
| Lift Four Dwellings Primary | B+ | 68% | 68% |
| St John Fisher Catholic Primary School | B+ | 28% | 68% |
| Regents Park Community Primary School | B | 79% | 67% |
| William Murdoch Primary School | B | 48% | 67% |
| Acocks Green Primary School | B | 44% | 67% |
| St Nicholas Catholic Primary School | B | 4% | 67% |
| St Thomas Church of England Primary School | B | 50% | 67% |
| Somerville Primary (NC) School | B | 63% | 66% |
| Boldmere Junior School | B | 16% | 66% |
| Bournville Village Primary | B | 13% | 66% |
| SS John and Monica Catholic Primary School | B | 36% | 66% |
| Chilwell Croft Academy | B | 79% | 66% |
| St George's Church of England Primary School | B | 58% | 66% |
| St Chad's Catholic Primary School | B | 86% | 66% |
| Kings Heath Primary School | B | 27% | 65% |
| Parkfield Community School | B | 63% | 65% |
| Tiverton Academy | B | 35% | 65% |
| St Joseph's Catholic Primary School | B | 7% | 65% |
| The Oval School | B | 66% | 65% |
| Cotteridge Primary School | B− | 21% | 64% |
| Ward End Primary School | B− | 56% | 64% |
| Kingsland Primary School (NC) | B− | 60% | 64% |
| Park Hill Primary School | B− | 52% | 64% |
| Thornton Primary School | B− | 61% | 64% |
| St Saviour's C of E Primary School | B− | 58% | 64% |
| Holy Family Catholic Primary School | B− | 62% | 64% |
| Warren Farm Primary School | B− | 53% | 64% |
| Oasis Academy Blakenhale Junior | B− | 60% | 64% |
| Woodhouse Primary Academy | B− | 48% | 64% |
| Oasis Academy Foundry | B− | 74% | 64% |
| St Paul's Catholic Primary School | B− | 66% | 64% |
| Waverley School | B− | 54% | 64% |
| Birchfield Primary School | B− | 48% | 64% |
| Calshot Primary School | B− | 32% | 63% |
| St James Church of England Primary School, Handsworth | B− | 53% | 63% |
| St Margaret Mary RC Junior and Infant School | B− | 50% | 63% |
| Wheelers Lane Primary School | B− | 42% | 63% |
| St John's & St Peter's CofE Primary | B− | 68% | 63% |
| Pegasus Primary School | B− | 71% | 63% |
| Brownmead Primary Academy | B− | 62% | 63% |
| Gossey Lane Academy | B− | 73% | 63% |
| City Road Primary School | B− | 47% | 63% |
| Saint Barnabas Church of England Primary School | B− | 37% | 63% |
| St Mark's Catholic Primary School | B− | 40% | 63% |
| The Oaks Primary School | B− | 86% | 63% |
| Lakey Lane Primary School | B− | 54% | 63% |
| Cherry Orchard Primary School | B− | 28% | 62% |
| New Hall Primary School | B− | 42% | 62% |
| St Bernadette's Catholic Primary School | B− | 48% | 62% |
| Mere Green Primary School | B− | 14% | 62% |
| Chivenor Primary School | B− | 69% | 62% |
| Green Meadow Primary School | B− | 43% | 62% |
| Jervoise School | B− | 59% | 62% |
| Highfield Junior and Infant School | B− | 48% | 62% |
| Yew Tree Community Junior and Infant School (NC) | B− | 62% | 62% |
| Westminster Primary School | B− | 57% | 62% |
| St Peter and St Paul RC Junior and Infant School | B− | 21% | 62% |
| Yenton Primary School | B− | 62% | 62% |
| Clifton Primary School | B− | 62% | 61% |
| Kings Rise Academy | B− | 65% | 61% |
| Maryvale Catholic Primary School | B− | 41% | 61% |
| St Teresa's Catholic Primary School | B− | 29% | 61% |
| Barford Primary School | C+ | 61% | 60% |
| Redhill Primary School | C+ | 59% | 60% |
| Nelson Mandela School | C+ | 54% | 60% |
| St Martin de Porres Catholic Primary School | C+ | 41% | 60% |
| Hollyfield Primary School | C+ | 31% | 60% |
| West Heath Primary School | C+ | 53% | 60% |
| Heathlands Primary Academy | C+ | 54% | 60% |
| Nonsuch Primary School | C+ | 60% | 60% |
| Kings Norton Primary School | C+ | 32% | 60% |
| Woodthorpe Junior and Infant School | C+ | 21% | 60% |
| Grendon Primary School | C+ | 54% | 59% |
| Raddlebarn Primary School | C+ | 24% | 59% |
| Severne Junior Infant and Nursery School | C+ | 72% | 59% |
| English Martyrs' Catholic Primary School | C+ | 55% | 59% |
| St Cuthbert's RC Junior and Infant (NC) School | C+ | 59% | 59% |
| Erdington Hall Primary School | C+ | 55% | 59% |
| St John's CofE Primary School | C+ | 55% | 59% |
| The Orchards Primary Academy | C+ | 55% | 59% |
| Manor Park Primary Academy | C+ | 63% | 59% |
| St Francis Church of England Aided Primary School and Nursery | C+ | 13% | 59% |
| Broadmeadow Junior School | C+ | 60% | 59% |
| Colebourne Primary School | C+ | 41% | 58% |
| Ladypool Primary School | C+ | 72% | 58% |
| Featherstone Primary School | C+ | 50% | 58% |
| Welford Primary School | C+ | 63% | 58% |
| Yardley Primary School | C+ | 45% | 58% |
| Tame Valley Academy | C+ | 68% | 58% |
| Leigh Primary School | C+ | 53% | 58% |
| Turves Green Primary School | C+ | 62% | 58% |
| Colmers Farm Primary School | C+ | 56% | 58% |
| Star King Solomon Academy | C+ | 55% | 58% |
| Lyndon Green Junior School | C | 42% | 57% |
| Marsh Hill Primary School | C | 52% | 57% |
| World's End Junior School | C | 58% | 57% |
| Christ Church CofE Controlled Primary School and Nursery | C | 62% | 57% |
| Brookvale Primary School | C | 46% | 57% |
| Fairway Primary Academy | C | 54% | 57% |
| Beeches Primary School | C | 49% | 56% |
| Anderton Park Primary School | C | 66% | 56% |
| St Edward's Catholic Primary School | C | 29% | 56% |
| Hawkesley Church Primary Academy | C | 67% | 56% |
| Holy Trinity CE Primary Academy (Handsworth) | C | 60% | 56% |
| Hillstone Primary School | C | 48% | 56% |
| Greet Primary School | C | 59% | 56% |
| Audley Primary School | C | 64% | 56% |
| St Joseph's Catholic Primary School | C | 78% | 56% |
| Cofton Primary School | C | 31% | 55% |
| Elms Farm Community Primary School | C | 63% | 55% |
| Grove School | C | 58% | 55% |
| King David Primary School | C | 37% | 55% |
| Oasis Academy Woodview | C | 58% | 55% |
| Yarnfield Primary School | C | 59% | 55% |
| Alston Primary School | C | 59% | 55% |
| Albert Bradbeer Primary Academy | C | 67% | 55% |
| The Rosary Catholic Primary School | C | 59% | 55% |
| Bellfield Junior School | C | 56% | 54% |
| St Patrick and St Edmund's Catholic Primary School | C | 42% | 54% |
| Mapledene Primary School | C | 46% | 54% |
| James Watt Primary School | C | 53% | 54% |
| The Oaklands Primary School | C | 58% | 54% |
| St Thomas More Catholic Primary School | C | 37% | 54% |
| Sacred Heart Catholic School | C | 54% | 54% |
| Stanville Primary School | C− | 51% | 53% |
| Stechford Primary School | C− | 51% | 53% |
| Kingsthorne Primary School | C− | 62% | 53% |
| Our Lady and St Rose of Lima Catholic Primary School | C− | 45% | 53% |
| Rookery School | C− | 56% | 53% |
| Washwood Heath Academy | C− | 58% | 53% |
| Hodge Hill Primary School | C− | 41% | 53% |
| St Francis Catholic Primary School | C− | 65% | 53% |
| Reaside Academy | C− | 69% | 52% |
| Grestone Academy | C− | 48% | 52% |
| Robin Hood Academy | C− | 45% | 52% |
| Wychall Primary School | C− | 72% | 52% |
| Springfield Primary Academy | C− | 57% | 52% |
| SS Mary & John Catholic Primary School | C− | 57% | 52% |
| Brookfields Primary School | C− | 58% | 52% |
| Rednal Hill Junior School | C− | 42% | 51% |
| Mansfield Green E-ACT Academy | C− | 65% | 51% |
| St Marys C of E Primary and Nursery, Academy, Handsworth | C− | 36% | 51% |
| Wyndcliffe Primary School | C− | 66% | 51% |
| Chandos Primary School | C− | 62% | 51% |
| Our Lady's Catholic Primary School | C− | 49% | 51% |
| Heath Mount Primary School | C− | 57% | 51% |
| Hollywood Primary School | C− | 38% | 51% |
| Holy Souls Catholic Primary School | C− | 43% | 50% |
| Timberley Academy | C− | 64% | 49% |
| St Clement's Church of England Academy | C− | 76% | 49% |
| St Michael's Church of England Primary School | C− | 57% | 49% |
| Conway Primary School | C− | 70% | 49% |
| Guardian Angels Catholic Primary School | C− | 52% | 49% |
| Kitwell Primary School | C− | 70% | 48% |
| Sutton Park Primary | C− | 58% | 48% |
| Paganel Primary School | C− | 64% | 48% |
| The Meadows Primary School | C− | 44% | 48% |
| Sundridge Primary School | D | 56% | 47% |
| Glenmead Primary School | D | 45% | 47% |
| Gunter Primary School | D | 51% | 46% |
| Cedars Academy | D | 59% | 46% |
| Blakesley Hall Primary School | D | 60% | 45% |
| Woodgate Primary School | D | 58% | 45% |
| Bournville School | D | 66% | 45% |
| Woodcock Hill Primary School | D | 69% | 44% |
| St George's Church of England Academy, Newtown | D | 75% | 44% |
| Allens Croft Primary School | D | 63% | 43% |
| Bordesley Green Primary School | D | 58% | 42% |
| Harper Bell Seventh-day Adventist School | D | 33% | 42% |
| Yardley Wood Community Primary School | D | 60% | 41% |
| Marlborough Primary School | D | 55% | 40% |
| Court Farm Primary School | D | 62% | 40% |
| Welsh House Farm Community School and Special Needs Resources Base | D− | 79% | 38% |
| Topcliffe Primary School | D− | 72% | 38% |
| Osborne Primary School | D− | 66% | 38% |
| St Wilfrid's Catholic Junior and Infant School | D− | 51% | 38% |
| Paget Primary School | D− | 53% | 38% |
| Anglesey Primary School | D− | 72% | 37% |
| George Dixon Primary School | D− | 49% | 36% |
| St Benedict's Primary School | D− | 56% | 36% |
| St Vincent's Catholic Primary School | D− | 72% | 36% |
| Firs Primary School | D− | 74% | 35% |
| E-ACT Nechells Academy | D− | 73% | 32% |
| Forestdale Primary School | D− | 63% | 25% |
Who goes here
DfE school census, January 2025333 pupils. SEN support is extra help in school for a special educational need; an EHC plan is the council’s legal plan for pupils who need more.
Girls and boys
Heath Mount Primary School’s letter
Its own results against England’s schools, not the town’s School Grade.
How school letters are worked out
Each school’s measure is compared with every graded school in England of the same phase: for primaries, the share of pupils meeting the expected standard in reading, writing and maths (DfE’s three-year average); for secondaries, Attainment 8 and the share with grade 5 or above in English and maths, each turned into a z-score against England’s schools and averaged. The letter comes from the share of those schools it beats, in the same bands as every grade on the site. The same method gives U.S. schools their letters, against their own state.
Graded: England’s open mainstream state schools with published results (grammar schools included, which select by test). Not graded: special schools, alternative provision, nurseries, 16–19 colleges, UTCs and studio schools, Welsh schools. Ofsted plays no part.
Ofsted inspections
Shown, not graded: Ofsted is never part of a letter or the School Grade.
Report card, inspection starting April 2026.
Living near Heath Mount Primary School
For families thinking of moving: what homes cost around the school, and the other schools close by.
Home prices in B12 9, the school’s postcode sector
Birmingham property prices →Median sale price each year, 2010 to 2025
By type, the 36 months to August 2026
Homes in B12 9 sell for a little over Birmingham’s typical price. HM Land Registry Price Paid, standard sales. Catchments aren’t published, so the postcode sector stands in for “around the school”.
Schools within 1.6 miles
35 state schoolsLocation
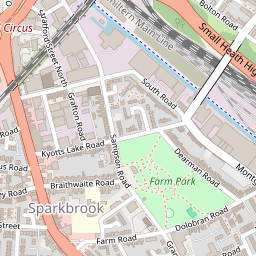
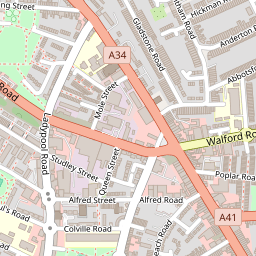
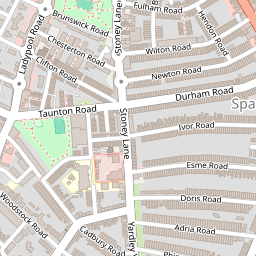
Directions ↗Birmingham, B12 9SR
Heath Mount Primary School: common questions
Is Heath Mount Primary School a good school?
By its published results, below average: its Key Stage 2 results are better than 20% of England’s primary schools (its letter is C−), with 51% of pupils meeting the expected standard in reading, writing and maths, against 62% for England’s schools. Ofsted: a report card in April 2026.
How hard is it to get into Heath Mount Primary School?
For September 2026, 13 families put Heath Mount Primary School first and all of them were offered a place; 18 places were offered in all.
What is Heath Mount Primary School’s Ofsted rating?
Its latest inspection (April 2026) gave a report card: achievement expected standard, safeguarding met. Ofsted stopped giving one-word overall grades in September 2024.
How much do houses cost near Heath Mount Primary School?
Homes in its postcode sector, B12 9, sold for a median £240,500 over the 36 months to August 2026 (192 sales).
Sources: DfE Get Information about Schools (16 October 2026), Key Stage 2 performance tables (2023–2025, three-year average) and Key Stage 4 (2025/26, provisional); Ofsted state-funded school inspections as at 30 September 2026. All under the Open Government Licence v3.0.
Also: DfE Key Stage 4 performance, schools data (2023/24 and 2024/25 final, 2025/26 provisional) and Key Stage 2 performance tables 2024/25 by subject; DfE school census, January 2025; DfE school-level applications and offers, September 2019 to 2026 entry; HM Land Registry Price Paid by postcode sector, 2010 to August 2026.
A school’s letter is our own summary of its published results against England’s schools of the same phase; Birmingham’s School Grade is a separate grade, built from the results of the schools in and around the town against other towns. Map: © OpenStreetMap contributors.
Contains public sector information licensed under the Open Government Licence v3.0. Contains HM Land Registry data © Crown copyright and database right 2026. Contains OS data © Crown copyright and database right 2026 (ONS boundaries). Northern Ireland: Source: NISRA; contains Land & Property Services data and Ordnance Survey of Northern Ireland information, © Crown copyright, licensed under the Open Government Licence v3.0. Scotland: contains National Records of Scotland data, Registers of Scotland data and SEPA data, © Crown copyright / © SEPA 2025, licensed under the Open Government Licence v3.0.