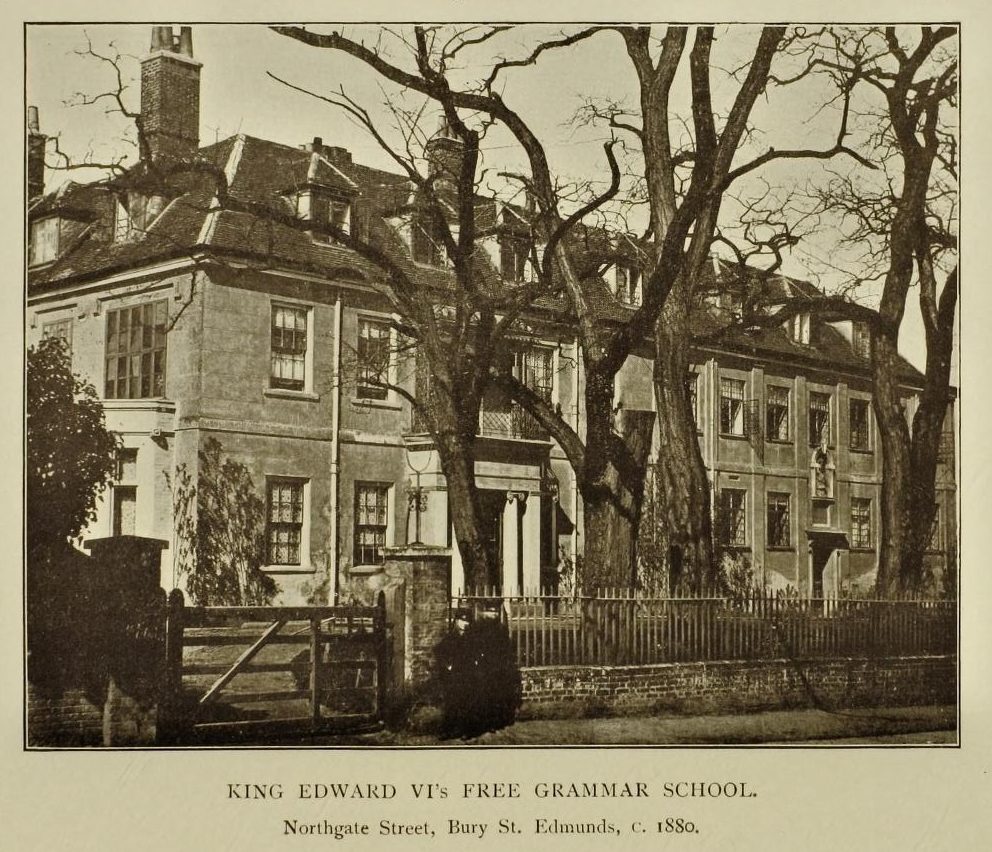
King Edward VI CEVC School
Bury St Edmunds, IP33 3BH · Suffolk local authority
Bury St Edmunds’s School Grade C better than 33% of towns in England
What stands out about King Edward VI CEVC School
- Its own letter, C: GCSE results better than 30% of England’s secondary schools
- 37% get grade 5 or above in English and maths, 10 points below England’s schools
- Ofsted: Inspected, October 2024 (shown, not graded)
- 94% of families who put it first got a place for September 2026 (212 of 226)
- Progress 8 of -0.10 in 2023/24, the last year DfE published it: pupils did about as well at GCSE as pupils nationally with the same results at 11
- Homes in its postcode sector (IP33 3) sold for a median £300,000; Bury St Edmunds’s is £288,750
Results
DfE · GCSEs 2025/26, provisional · 238 pupilsEach bar is a group of England’s 3,224 graded secondary schools. The schools King Edward VI CEVC beats are shaded green.
Attainment 8 42.4
Average grade across 8 GCSEs ×10 · higher than 30% of schools · Suffolk avg 43.4
Grade 5+ in English and maths 37%
A strong pass · higher than 30% of schools · Suffolk avg 40%
Attainment 8, three years
The mark is England’s average that year
Progress 8, 2023/24
-0.10: about average. How pupils did at GCSE against pupils nationally with the same results at 11. Not published since 2023/24 (no Key Stage 2 tests in 2020 and 2021).
Disadvantaged pupils, 2025/26
Attainment 8 for the 55 pupils DfE counts as disadvantaged (free school meals in the last 6 years, or looked after) and the rest, beside England’s schools
England’s figures are of its graded mainstream state schools, each school counted once; grammar schools are included, which is why the right-hand tail is long. Small cohorts are suppressed.
How hard is it to get a place at King Edward VI CEVC School?
94% of the families who put it first got a place for September 2026.
Years when some first choices missed out: 2019 (63), 2020 (36), 2021 (56), 2023 (33), 2024 (67), 2025 (2), 2026 (14). The council runs the coordinated admissions; each school’s rules (siblings, distance, faith) decide who gets in. DfE doesn’t publish the furthest distance offered, so check the council’s admissions booklet for that. Suffolk council sets the admissions rules. Apply through Suffolk council’s coordinated admissions.
Outline = places offered · green = families who put it first · striped = more first choices than places
94% got their first choice
Bury St Edmunds and Suffolk, side by side
2025/26All 43 graded secondaries in Suffolk. Schools with more pupils on free school meals usually score lower, so a school above the crowd for its free school meals is doing better than its intake predicts. Bury St Edmunds’s schools are coloured by their letter.
Show as a table
| School | Letter | Free school meals | Attainment 8 |
|---|---|---|---|
| Sybil Andrews Academy | A− | 15% | 52.6 |
| Hartismere School | A− | 12% | 52.4 |
| St Benedict's Catholic School | B+ | 12% | 51.9 |
| Debenham High School | A− | 14% | 51.5 |
| East Bergholt High School | B+ | 17% | 49.8 |
| Northgate High School | B+ | 20% | 49.5 |
| East Point Academy | B+ | 44% | 49.2 |
| Copleston High School | B | 20% | 48.3 |
| Thomas Mills High School & Sixth Form | B− | 19% | 47.8 |
| Stradbroke High School | B | 22% | 47.4 |
| Kesgrave High School | B | 15% | 47 |
| Sir John Leman High School | B | 23% | 46.7 |
| Thomas Gainsborough School | B− | 20% | 46.7 |
| Benjamin Britten Academy of Music and Mathematics | B | 31% | 46.6 |
| Thurston Community College | B− | 19% | 45.9 |
| Hadleigh High School | C+ | 23% | 45.6 |
| St Alban's Catholic High School | C+ | 21% | 45.3 |
| Farlingaye High School | C+ | 19% | 45.2 |
| Claydon High School | B− | 23% | 45.2 |
| Bury St Edmunds County High School | B− | 26% | 44.8 |
| Stour Valley Community School | C+ | 19% | 44.5 |
| Newmarket Academy | C | 23% | 43.6 |
| Ormiston Sudbury Academy | C | 36% | 43.2 |
| Stowmarket High School | C | 21% | 42.5 |
| King Edward VI CEVC School | C | 22% | 42.4 |
| Pakefield High School | C+ | 38% | 42.3 |
| Bungay High School | C− | 26% | 42.1 |
| Ormiston Endeavour Academy | C− | 32% | 40.4 |
| Ipswich Academy | C− | 42% | 40.3 |
| Felixstowe School | C | 26% | 40.3 |
| Holbrook Academy | C− | 23% | 40.1 |
| Stowupland High School | D | 29% | 40.1 |
| Ixworth High School | C− | 22% | 39.7 |
| Castle Manor Academy | D | 30% | 39.5 |
| Mildenhall College Academy | C− | 24% | 39.5 |
| Breckland School | C− | 26% | 38.9 |
| Samuel Ward Academy | C− | 18% | 38.2 |
| Westbourne Academy | C− | 39% | 38.2 |
| Ormiston Denes Academy | D | 58% | 37.7 |
| Chantry Academy | C− | 39% | 36.7 |
| Stoke High School - Ormiston Academy | D | 42% | 36 |
| Alde Valley Academy | D | 33% | 33.9 |
| Beccles High School | D− | 50% | 25.4 |
Who goes here
DfE school census, January 20251,199 pupils. SEN support is extra help in school for a special educational need; an EHC plan is the council’s legal plan for pupils who need more.
Girls and boys
King Edward VI CEVC School’s letter
Its own results against England’s schools, not the town’s School Grade.
How school letters are worked out
Each school’s measure is compared with every graded school in England of the same phase: for primaries, the share of pupils meeting the expected standard in reading, writing and maths (DfE’s three-year average); for secondaries, Attainment 8 and the share with grade 5 or above in English and maths, each turned into a z-score against England’s schools and averaged. The letter comes from the share of those schools it beats, in the same bands as every grade on the site. The same method gives U.S. schools their letters, against their own state.
Graded: England’s open mainstream state schools with published results (grammar schools included, which select by test). Not graded: special schools, alternative provision, nurseries, 16–19 colleges, UTCs and studio schools, Welsh schools. Ofsted plays no part.
Ofsted inspections
Shown, not graded: Ofsted is never part of a letter or the School Grade.
Ungraded inspection: Standards maintained, October 2024.
Living near King Edward VI CEVC School
For families thinking of moving: what homes cost around the school, and the other schools close by.
Home prices in IP33 3, the school’s postcode sector
Bury St Edmunds property prices →Median sale price each year, 2010 to 2025
By type, the 36 months to August 2026
Homes in IP33 3 sell for a little over Bury St Edmunds’s typical price. HM Land Registry Price Paid, standard sales. Catchments aren’t published, so the postcode sector stands in for “around the school”.
Schools within 1.6 miles
11 state schoolsLocation
Directions ↗


Bury St Edmunds, IP33 3BH
King Edward VI CEVC School: common questions
Is King Edward VI CEVC School a good school?
By its published results, below average: its GCSE results are better than 30% of England’s secondary schools (its letter is C), with an Attainment 8 of 42.4 and 37% getting grade 5 or above in English and maths, against 47.3 and 47% for England’s schools. Ofsted: Inspected, October 2024.
How hard is it to get into King Edward VI CEVC School?
For September 2026, 226 families put King Edward VI CEVC School first and 212 of them were offered a place; 225 places were offered in all.
What is King Edward VI CEVC School’s Ofsted rating?
Its latest inspection outcome is Inspected (October 2024).
How much do houses cost near King Edward VI CEVC School?
Homes in its postcode sector, IP33 3, sold for a median £300,000 over the 36 months to August 2026 (534 sales).
Sources: DfE Get Information about Schools (16 October 2026), Key Stage 2 performance tables (2023–2025, three-year average) and Key Stage 4 (2025/26, provisional); Ofsted state-funded school inspections as at 30 September 2026. All under the Open Government Licence v3.0.
Also: DfE Key Stage 4 performance, schools data (2023/24 and 2024/25 final, 2025/26 provisional) and Key Stage 2 performance tables 2024/25 by subject; DfE school census, January 2025; DfE school-level applications and offers, September 2019 to 2026 entry; HM Land Registry Price Paid by postcode sector, 2010 to August 2026.
A school’s letter is our own summary of its published results against England’s schools of the same phase; Bury St Edmunds’s School Grade is a separate grade, built from the results of the schools in and around the town against other towns. Map: © OpenStreetMap contributors.
Contains public sector information licensed under the Open Government Licence v3.0. Contains HM Land Registry data © Crown copyright and database right 2026. Contains OS data © Crown copyright and database right 2026 (ONS boundaries). Northern Ireland: Source: NISRA; contains Land & Property Services data and Ordnance Survey of Northern Ireland information, © Crown copyright, licensed under the Open Government Licence v3.0. Scotland: contains National Records of Scotland data, Registers of Scotland data and SEPA data, © Crown copyright / © SEPA 2025, licensed under the Open Government Licence v3.0.