




The Kilburn Park School Foundation
Brent, NW6 5RG · Brent local authority
Brent’s School Grade A− better than 84% of towns in England
What stands out about The Kilburn Park School Foundation
- Its own letter, C: Key Stage 2 results better than 34% of England’s primary schools
- Room to spare: 55 pupils for 240 places
- 51% of pupils are eligible for free school meals (more than England’s 25%)
- Ofsted: Inspected, April 2025 (shown, not graded)
- Homes in its postcode sector (NW6 5) sold for a median £532,500; Brent’s is £551,464
Results
DfE · Key Stage 2Reading, writing and maths 57%
Met the expected standard, DfE’s 3-year average 2023–2025 · higher than 34% of England’s 14,979 graded primaries · Brent avg 67%
Each subject, 2025
Met the expected standard; the mark is England’s schools · average scaled score: reading 101, maths 103 (100 = the expected standard)
Disadvantaged pupils, 2025
Met the expected standard in reading, writing and maths: the 12 disadvantaged pupils and the rest, beside England’s schools
England’s figures are of its graded mainstream state schools, each school counted once; grammar schools are included, which is why the right-hand tail is long. Small cohorts are suppressed.
Brent and Brent, side by side
2023–2025All 53 graded primaries in Brent. Schools with more pupils on free school meals usually score lower, so a school above the crowd for its free school meals is doing better than its intake predicts. Brent’s schools are coloured by their letter.
Show as a table
| School | Letter | Free school meals | KS2 expected standard |
|---|---|---|---|
| Ark Franklin Primary Academy | A+ | 19% | 96% |
| St Joseph's Roman Catholic Primary School | A+ | 24% | 93% |
| East Lane Primary School | A+ | 10% | 93% |
| St Joseph's Catholic Junior School | A+ | 10% | 89% |
| Our Lady of Grace Catholic Junior School | A+ | 23% | 88% |
| St Robert Southwell Catholic Primary School | A | 8% | 81% |
| Sinai Jewish Primary School | A | 3% | 81% |
| Ark Academy | A | 42% | 81% |
| Princess Frederica CofE Primary School | A | 9% | 80% |
| North West London Jewish Day School | A | 1% | 79% |
| Islamia Primary School | A | 34% | 77% |
| Park Lane Primary School | A | 29% | 76% |
| Braintcroft E-ACT Primary Academy | A | 43% | 76% |
| Uxendon Manor Primary School | A− | 9% | 73% |
| Sudbury Primary School | A− | 25% | 72% |
| Mitchell Brook Primary School | A− | 42% | 71% |
| Mora Primary School | A− | 27% | 71% |
| St Mary's CofE Primary School | A− | 44% | 71% |
| Wembley Primary School | A− | 26% | 71% |
| St Andrew and St Francis CofE Primary School | A− | 39% | 71% |
| Barham Primary School | B+ | 14% | 69% |
| Newfield Primary School | B | 50% | 67% |
| Kingsbury Green Primary School | B | 25% | 66% |
| Salusbury Primary School | B | 19% | 66% |
| Preston Manor School | B | 31% | 66% |
| Gladstone Park Primary School | B | 35% | 66% |
| Chalkhill Primary School | B | 32% | 65% |
| Kilburn Grange School | B | 64% | 65% |
| Malorees Primary School | B− | 19% | 64% |
| Wykeham Primary School | B− | 30% | 64% |
| Anson Primary School | B− | 32% | 62% |
| John Keble CofE Primary School | B− | 33% | 62% |
| Oliver Goldsmith Primary School | B− | 17% | 61% |
| Christ Church CofE Primary School | B− | 28% | 61% |
| St Mary Magdalen's Catholic Junior School | B− | 28% | 61% |
| St Margaret Clitherow RC Primary School | B− | 26% | 61% |
| St Mary's RC Primary School | C+ | 37% | 59% |
| Brentfield Primary School | C+ | 41% | 58% |
| Harlesden Primary School | C+ | 53% | 58% |
| Leopold Primary School | C+ | 39% | 58% |
| Northview Junior and Infant School | C | 45% | 57% |
| Preston Park Primary School | C | 20% | 57% |
| Donnington Primary School | C | 39% | 57% |
| The Kilburn Park School Foundation | C | 51% | 57% |
| Avigdor Hirsch Torah Temimah Primary School | C | 3% | 56% |
| Oakington Manor Primary School | C | 18% | 56% |
| Furness Primary School | C− | 36% | 53% |
| Lyon Park Primary School | C− | 14% | 50% |
| Elsley Primary School | C− | 24% | 50% |
| Our Lady of Lourdes Catholic Primary School | C− | 37% | 49% |
| Fryent Primary School | C− | 21% | 48% |
| The Stonebridge School | D | 56% | 45% |
| Roe Green Junior School | D | 14% | 41% |
Who goes here
DfE school census, January 202562 pupils. SEN support is extra help in school for a special educational need; an EHC plan is the council’s legal plan for pupils who need more.
Girls and boys
The Kilburn Park School Foundation’s letter
Its own results against England’s schools, not the town’s School Grade.
How school letters are worked out
Each school’s measure is compared with every graded school in England of the same phase: for primaries, the share of pupils meeting the expected standard in reading, writing and maths (DfE’s three-year average); for secondaries, Attainment 8 and the share with grade 5 or above in English and maths, each turned into a z-score against England’s schools and averaged. The letter comes from the share of those schools it beats, in the same bands as every grade on the site. The same method gives U.S. schools their letters, against their own state.
Graded: England’s open mainstream state schools with published results (grammar schools included, which select by test). Not graded: special schools, alternative provision, nurseries, 16–19 colleges, UTCs and studio schools, Welsh schools. Ofsted plays no part.
Ofsted inspections
Shown, not graded: Ofsted is never part of a letter or the School Grade.
Graded inspection: Good, October 2019. Ungraded inspection: Standards maintained, April 2025.
Living near The Kilburn Park School Foundation
For families thinking of moving: what homes cost around the school, and the other schools close by.
Home prices in NW6 5, the school’s postcode sector
Brent property prices →Median sale price each year, 2010 to 2025
By type, the 36 months to August 2026
Homes in NW6 5 sell for a little under Brent’s typical price. HM Land Registry Price Paid, standard sales. Catchments aren’t published, so the postcode sector stands in for “around the school”.
Schools within 1.6 miles
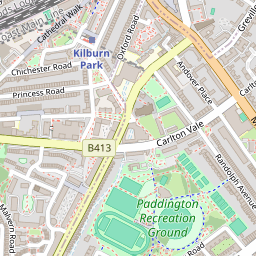
57 state schoolsLocation
Directions ↗Brent, NW6 5RG
The Kilburn Park School Foundation: common questions
Is The Kilburn Park School Foundation a good school?
By its published results, below average: its Key Stage 2 results are better than 34% of England’s primary schools (its letter is C), with 57% of pupils meeting the expected standard in reading, writing and maths, against 62% for England’s schools. Ofsted: Inspected, April 2025.
What is The Kilburn Park School Foundation’s Ofsted rating?
Its latest inspection outcome is Inspected (April 2025).
How much do houses cost near The Kilburn Park School Foundation?
Homes in its postcode sector, NW6 5, sold for a median £532,500 over the 36 months to August 2026 (244 sales).
Sources: DfE Get Information about Schools (16 October 2026), Key Stage 2 performance tables (2023–2025, three-year average) and Key Stage 4 (2025/26, provisional); Ofsted state-funded school inspections as at 30 September 2026. All under the Open Government Licence v3.0.
Also: DfE Key Stage 4 performance, schools data (2023/24 and 2024/25 final, 2025/26 provisional) and Key Stage 2 performance tables 2024/25 by subject; DfE school census, January 2025; DfE school-level applications and offers, September 2019 to 2026 entry; HM Land Registry Price Paid by postcode sector, 2010 to August 2026.
A school’s letter is our own summary of its published results against England’s schools of the same phase; Brent’s School Grade is a separate grade, built from the results of the schools in and around the town against other towns. Map: © OpenStreetMap contributors.
Contains public sector information licensed under the Open Government Licence v3.0. Contains HM Land Registry data © Crown copyright and database right 2026. Contains OS data © Crown copyright and database right 2026 (ONS boundaries). Northern Ireland: Source: NISRA; contains Land & Property Services data and Ordnance Survey of Northern Ireland information, © Crown copyright, licensed under the Open Government Licence v3.0. Scotland: contains National Records of Scotland data, Registers of Scotland data and SEPA data, © Crown copyright / © SEPA 2025, licensed under the Open Government Licence v3.0.