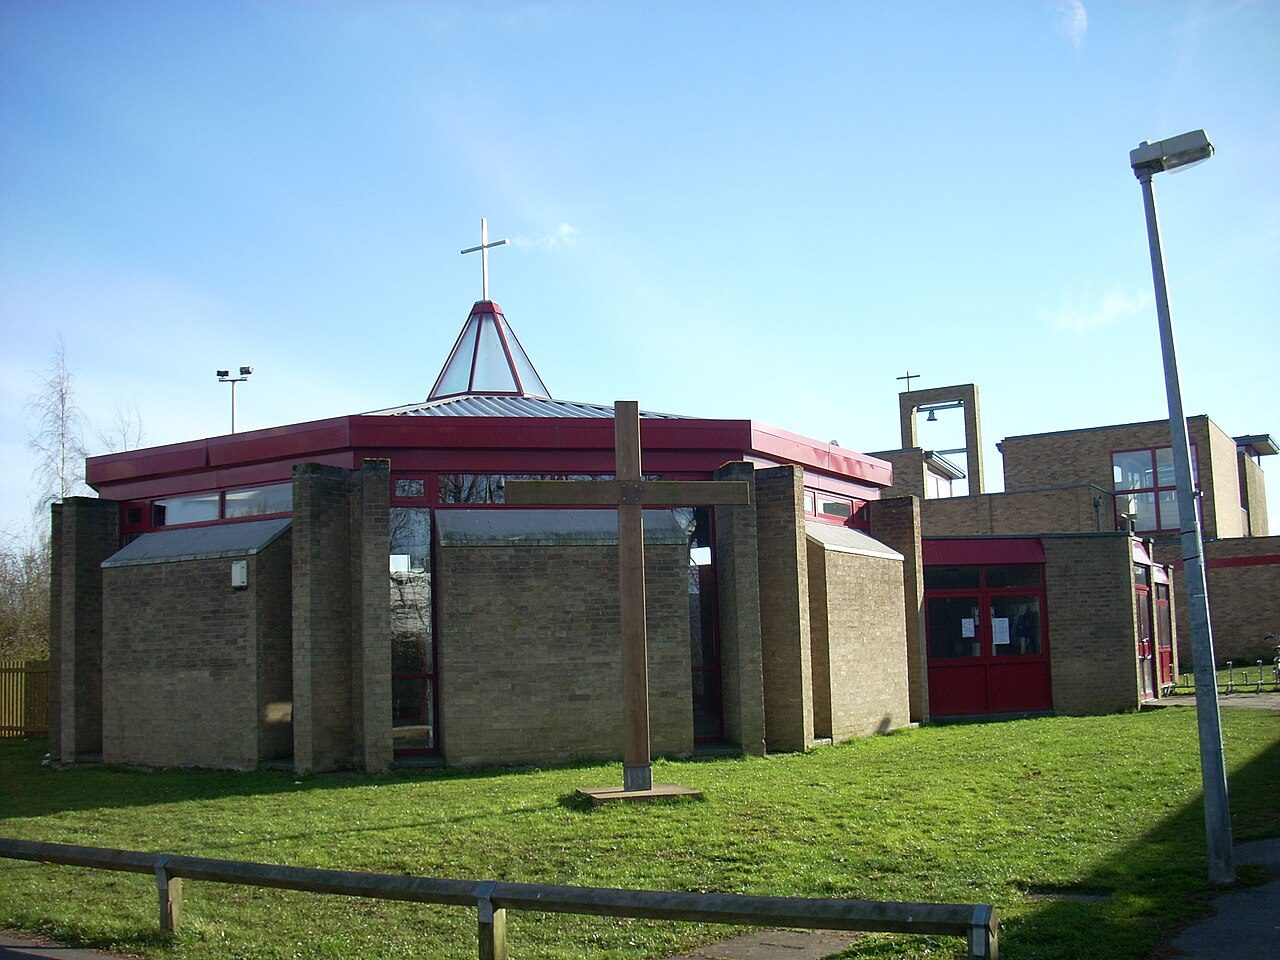
 Photo: Cruccone · CC BY 3.0
Measured against local pay, Bar Hill is cheaper to live in than 90% of UK towns
The median home in Bar Hill sold for £310,000. That is the middle of 145 standard sales from September 2023 to August 2026, against £277,000 in the typical UK town. Bar Hill grades A for cost of living: prices, rent and council tax against what households in the area earn, #9 of 50 in Cambridgeshire.
What Bar Hill’s housing numbers say
Prices have risen more slowly than the typical town
Over ten years the median sale in Bar Hill went up 35%; in the typical UK town it went up 42%. Since 1995–96 prices have gone up 5.9 times, from £53,997. Price trend ↓
Written from the data on this page: HM Land Registry sales since 1995, ONS private rents and household income, and council tax from MHCLG and the Welsh Government.
Bar Hill grades A for cost of living
Each cost against what households in the South Cambridgeshire council area earn (£72,422 a year, mean), ranked against UK towns.
Council tax helps it: cheaper for local incomes than in 91% of UK towns. Bar Hill is #9 of 50 Cambridgeshire towns for cost of living.
Up 18% in five years
The median of every standard sale in Bar Hill each year (September to August), against the typical UK town of 2,500+ (the middle of all their medians). Ten years: Bar Hill +35%, typical town +42%. Five years: +18% against +11%.
Show as a table
| Year to August | Bar Hill | Typical town | Sales |
|---|---|---|---|
| 2025–26 | £320,000 | £277,000 | 44 |
| 2024–25 | £317,500 | £280,000 | 51 |
| 2023–24 | £285,000 | £275,000 | 50 |
| 2022–23 | £326,500 | £280,000 | 49 |
| 2021–22 | £282,000 | £265,000 | 62 |
| 2020–21 | £272,000 | £250,000 | 61 |
| 2019–20 | £277,000 | £230,000 | 39 |
| 2018–19 | £255,000 | £225,000 | 76 |
| 2017–18 | £245,000 | £219,950 | 59 |
| 2016–17 | £260,000 | £210,000 | 62 |
| 2015–16 | £237,500 | £195,000 | 69 |
| 2014–15 | £229,995 | £183,500 | 81 |
| 2013–14 | £197,995 | £173,500 | 71 |
| 2012–13 | £179,500 | £165,000 | 78 |
| 2011–12 | £166,500 | £162,500 | 64 |
| 2010–11 | £175,000 | £163,250 | 81 |
| 2009–10 | £159,000 | £163,975 | 74 |
| 2008–09 | £136,000 | £155,000 | 54 |
| 2007–08 | £175,500 | £172,625 | 62 |
| 2006–07 | £171,000 | £169,000 | 97 |
| 2005–06 | £154,950 | £159,000 | 87 |
| 2004–05 | £140,000 | £154,000 | 90 |
| 2003–04 | £130,000 | £141,250 | 121 |
| 2002–03 | £119,997 | £122,000 | 108 |
| 2001–02 | £105,000 | £94,950 | 126 |
| 2000–01 | £86,000 | £80,000 | 139 |
| 1999–00 | £79,950 | £71,000 | 141 |
| 1998–99 | £66,650 | £63,500 | 138 |
| 1997–98 | £63,000 | £59,437 | 133 |
| 1996–97 | £57,750 | £55,747 | 158 |
| 1995–96 | £53,997 | £52,000 | 122 |
The median Bar Hill home sold for £238K in the year to August 2016, and £320K in the year to August 2026.
HM Land Registry Price Paid, standard (category A) sales of houses and flats inside the built-up area, by the year to August. These are actual sale prices, not an index: a year with more flats or new builds moves the median as well as prices do. The newest months are still being registered.
What homes sell for, by type
Medians of 145 standard sales, September 2023 to August 2026. The tick on each bar is the typical UK town of 2,500+.
Against the typical UK town, semis here sell for 14% more and terraced houses 11% more.
Show as a table
| Type | Median | Sales | Share |
|---|---|---|---|
| Detached | £380,000 | 46 | 32% |
| Semi-detached | £303,000 | 40 | 28% |
| Terraced | £250,000 | 58 | 40% |
| Flat or maisonette | — | 1 | 1% |
HM Land Registry Price Paid: category A sales (one home at full market value), so repossessions, company buy-to-lets and bulk sales are left out. In the last 12 months the median was £320,000 (44 sales).
About 50 sales a year, down from 130 before 2008
Standard sales in Bar Hill each year to August. Since the 2008 crash the market here has run at about 40% of its mid-2000s pace.
The last bar (44 sales) is still filling: Land Registry adds a sale when the transfer is registered, often two to three months after completion.
A typical Bar Hill home costs 4.3 years of area income
Most lenders cap a mortgage at about 4.5 times household income. The calculator starts from the area’s mean household income; switch to your own.
An estimate, not a mortgage offer: borrowing of up to 4.5× income, a 25-year repayment mortgage at the rate shown, and Band D council tax (your band may differ). Stamp duty uses England’s rates from 1 April 2025, with first-time buyers’ relief. Other debts, fees and survey costs aren’t included.
A two-bedroom rents for about £1,281 a month
The average private rent in the South Cambridgeshire council area is £1,408 a month (August 2026): £51 less than England’s, £119 more than East of England’s.
By size a month, the tick is England
ONS Price Index of Private Rents: the mean rent of all private tenancies, new and existing (not asking rents), for the whole South Cambridgeshire council area. It’s the smallest area the ONS publishes.
Band D is £2,539 for 2026–27; South Cambridgeshire council’s average is the 3rd highest of Cambridgeshire’s 6
Bar Hill’s bill is the South Cambridgeshire council’s share with the county or combined authority, police and fire shares, plus the parish or town council precept of about £131 a year. England’s average Band D is £2,392. Since 1993–94, South Cambridgeshire’s average Band D has risen from £443: 472% in 33 years.
Average Band D 2026–27, by council
| Band value in 1991 | A year | A month |
|---|---|---|
| Band A up to £40,000 | £1,693 | £169 |
| Band B £40,001–52,000 | £1,975 | £197 |
| Band C £52,001–68,000 | £2,257 | £226 |
| Band D £68,001–88,000 | £2,539 | £254 |
| Band E £88,001–120,000 | £3,103 | £310 |
| Band F £120,001–160,000 | £3,668 | £367 |
| Band G £160,001–320,000 | £4,232 | £423 |
| Band H over £320,000 | £5,078 | £508 |
Your band comes from what your home would have sold for in April 1991, set by the Valuation Office Agency; look it up on GOV.UK. Each band pays a fixed fraction of Band D, from six ninths (A) to two (H). Living alone takes 25% off.
75% of households own their home; 20% rent privately
Census 2021, all households. Fewer households rent from a council or housing association than across Cambridgeshire’s towns (4% against 16%).
Cambridgeshire and England: all residents of their built-up areas (towns and cities), from the same Census 2021 output areas.
153rd of 627 UK towns its size for what a home costs against income
Median sale price ÷ the area’s mean household income, cheapest first, for UK towns of 3,000 to 5,000 people: the towns either side of Bar Hill, and others in Cambridgeshire.
| # | Town | Median home | ÷ income | Rent | Band D | Cost |
|---|---|---|---|---|---|---|
| 1 | Campbeltown Argyll and Bute | £74K | 1.7× | £869 | £1,783 | A− |
| … | ||||||
| 150 | South Darenth and Sutton at Hone Kent | £295K | 4.3× | £1,701 | £2,481 | B+ |
| 151 | Pwllheli Gwynedd | £192K | 4.3× | £724 | £2,469 | B+ |
| 152 | Spilsby Lincolnshire | £172K | 4.3× | £704 | £2,372 | B− |
| 153 | Bar Hill Cambridgeshire | £310K | 4.3× | £1,408 | £2,539 | A |
| 154 | Neyland Dyfed | £180K | 4.3× | £694 | £2,166 | A− |
| 155 | Innerleithen Scottish Borders | £191K | 4.3× | £760 | £1,619 | A+ |
| 156 | Upper Tean Staffordshire | £205K | 4.3× | £728 | £2,335 | A |
| … | ||||||
| 191 | Papworth Everard Cambridgeshire | £331K | 4.6× | £1,408 | £2,495 | A |
| … | ||||||
| 193 | Somersham Cambridgeshire | £290K | 4.6× | £1,057 | £2,586 | A |
| … | ||||||
| 210 | Warboys Cambridgeshire | £295K | 4.7× | £1,057 | £2,568 | A |
| … | ||||||
| 246 | Sutton Cambridgeshire | £300K | 5× | £1,038 | £2,510 | A |
| … | ||||||
| 627 | Brookmans Park Hertfordshire | £1M | 15.7× | £1,512 | £2,453 | D |
Rent and Band D are for each town’s main council area; Northern Ireland has no council tax (its towns pay domestic rates) and no council-area rents; Scotland’s rents are published for broad areas, not councils. Cost letters rank against every UK town of 1,000 or more; this order is context only.
Girton sells for £290K more than Bar Hill
Median sale, September 2023 to August 2026, for the built-up areas around Bar Hill, shaded against Bar Hill’s median. Five-year change where both years had 20+ sales.
| Town | Cost | Median | New | 5 yrs | Band D |
|---|---|---|---|---|---|
| Bar Hill | A | £310K | 0% | +18% | £2,539 |
| Oakington | A− | £390K | 0% | — | £2,517 |
| Longstanton and Northstowe | A− | £378K | 42% | +0.5% | £2,509 |
| Hardwick | B− | £494K | 37% | −2.7% | £2,484 |
| Girton | C+ | £600K | 38% | −1.3% | £2,524 |
| Swavesey | A− | £365K | 0% | −9.9% | £2,504 |
| Highfields Caldecote | B− | £555K | 14% | — | £2,521 |
| Histon and Impington | B | £450K | 0% | +25% | £2,542 |
Girton, 2.9 miles away, has the dearest homes nearby (£600,000). New builds were 42% of sales in Longstanton and Northstowe and 38% of sales in Girton.
What this data can and can’t tell you
- Sale prices aren’t valuations. A median is the middle sale, so a year with more flats or new builds moves it even if no home changed in value. The ONS House Price Index adjusts for the mix; it is published by council, not for Bar Hill’s built-up area.
- Rent is for the whole council. The ONS publishes private rents by council only, so the figure covers the whole South Cambridgeshire council area, not just Bar Hill.
- Income is a mean. The grade divides costs by the ONS’s mean household income for the council area (£72,422), which a few high earners pull up; the median household’s is lower.
- The newest months are thin. Land Registry registers a sale weeks or months after completion, so the year to August 2026 will gain sales as registrations catch up.
Questions about living costs in Bar Hill
Is Bar Hill expensive to live in?
The median home in Bar Hill sold for £310,000 between September 2023 and August 2026, £33,000 more than the typical UK town. That is 4.3 times the area’s mean household income, cheaper for local incomes than in 79% of UK towns. The average private rent of £1,408 a month takes 23% of that income.
Are house prices falling in Bar Hill?
The median sale was £320,000 in the year to August 2026, flat on the year before. Over five years prices went up 18%, and over ten went up 35%.
How much is rent in Bar Hill?
The ONS puts the average private rent in the South Cambridgeshire council area at £1,408 a month in August 2026: £1,010 for one bedroom, £1,281 for two, £1,530 for three and £2,148 for four or more. Rents went up 3% over the year, against 4% across England.
How much is council tax in Bar Hill?
Band D is £2,539 for 2026–27, against England’s average of £2,392. Band A is £1,693 and Band C £2,257. Your bill depends on your home’s band; check it on GOV.UK.
How much do I need to earn to buy in Bar Hill?
With a 10% deposit and borrowing of 4.5 times income, a household needs about £62,000 a year to buy the median Bar Hill home of £310,000.
Is Bar Hill cheaper than Cambridge?
Yes: Cambridge’s median sale was £484,602 over the same three years, against Bar Hill’s £310,000, and its average rent £1,786 a month against £1,408.
Sources: HM Land Registry Price Paid (standard sales, September 2023 to August 2026) · HM Land Registry Price Paid, every standard sale since 1995 (years to August), by council ward and postcode district · ONS Price Index of Private Rents (August 2026, by council) · ONS Price Index of Private Rents, monthly since January 2015 (councils, regions, England and Wales) · MHCLG and Welsh Government council tax, Band D 2026–27 (with parish precepts in England) · MHCLG Band D council tax by council, 1993–94 to 2026–27; Welsh Government council tax levels 2026–27 · ONS small-area income estimates (financial year ending 2023) · ONS Census 2021, output areas summed to the ONS 2022 built-up area · TownRatings grades: our own summary of the data, ranked against UK towns only. All under the Open Government Licence v3.0.
Contains public sector information licensed under the Open Government Licence v3.0. Contains HM Land Registry data © Crown copyright and database right 2026. Contains OS data © Crown copyright and database right 2026 (ONS boundaries). Northern Ireland: Source: NISRA; contains Land & Property Services data and Ordnance Survey of Northern Ireland information, © Crown copyright, licensed under the Open Government Licence v3.0. Scotland: contains National Records of Scotland data, Registers of Scotland data and SEPA data, © Crown copyright / © SEPA 2025, licensed under the Open Government Licence v3.0.