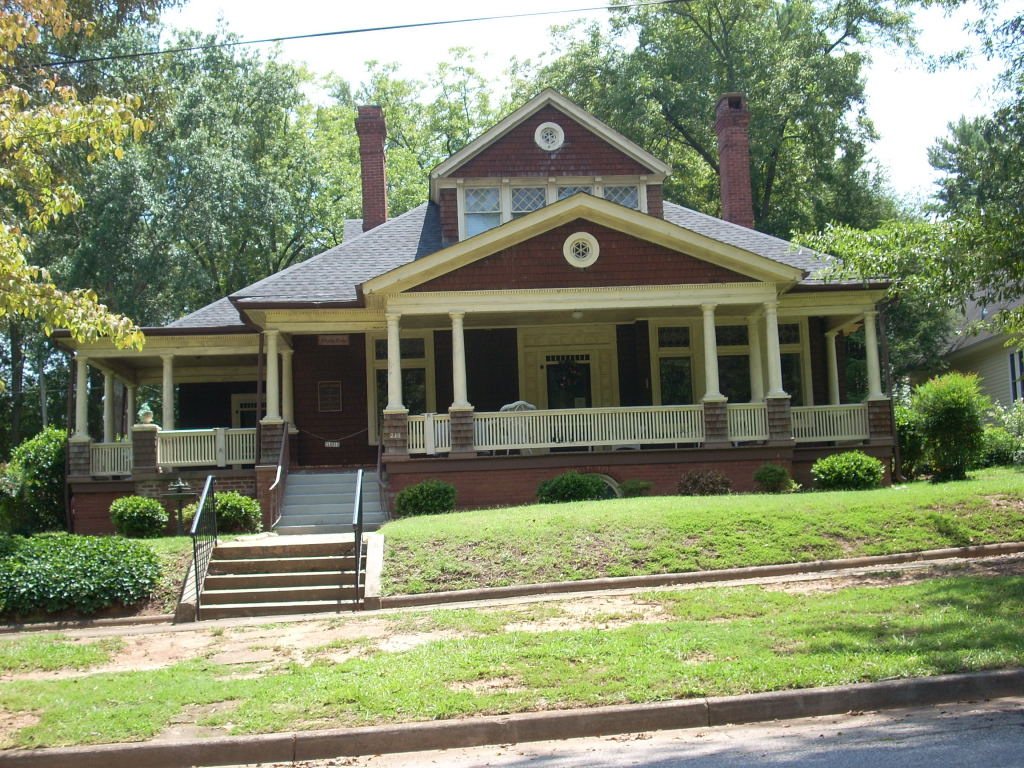
153 years in pictures
Census counts: 382 in 1880, 8,850 in 2020. The archive holds 12 old photos and papers going back to 1972 and 2 maps from 1958 on.
4 places on the National Register of Historic Places.
- 1873Seneca is settled
Each edition grades its towns against each other only.

Seneca grades C− overall, 120th of 167 graded towns in South Carolina, with clear strengths and some subjects that lag. On the other side, the median household income is $52K, and 22% of residents live below the poverty line. It also does better than most on schools: its schools outperform 68% of the state's. Its lowest everyday mark is in safety: its crime rate is higher than 80% of U.S. towns, with 43 violent crimes reported to the FBI in 2025. A typical home there costs about $305K, 4.9 years of the Seneca area’s $62K median household income. Seneca’s average trip to work is 16 minutes, against 24 minutes in South Carolina’s towns and 25 minutes across U.S. towns. Its National Register listings include Seneca Historic District and Ram Cat Alley Historic District.
Where Seneca beats most towns.
Each subject compared with towns across the country (schools within South Carolina), ordered by how far Seneca is from typical.
How TownRatings grades towns →
Census counts: 382 in 1880, 8,850 in 2020. The archive holds 12 old photos and papers going back to 1972 and 2 maps from 1958 on.
4 places on the National Register of Historic Places.
Who provides power, water and the rest in Seneca, and how to reach them.
EPA SDWIS (Oct 9, 2026) · HIFLD + EIA-861 2025 · Census 2020 ZCTAs · NCES 2024–25 · registration: vote.gov, updated Sep 12, 2025.
Ordered by what stands out in Seneca.
Seneca is healthier than towns with similar incomes, trades workers with Clemson and other neighbors and has more 90° days than most of the country, though not than most of South Carolina.
The violent crime rate in Seneca is 4.6 per 1,000 residents. Seneca reports more crime per resident than most U.S. towns we grade: about 80% report less. The property crime rate in Seneca is 14.3 per 1,000 residents.
| Seneca | South Carolina towns | U.S. towns | |
|---|---|---|---|
| Violent crimes per 1,000 (2025) | 4.6 per 1,000 residents | 3.9 | 1.6 |
| Property crimes per 1,000 (2025) | 14.3 per 1,000 residents | 21.7 | 9.9 |
FBI crime data, 2025 · crimes reported to police
Its public schools are run by the Oconee 01 school district. Two of its 5 schools are below, each with why it’s listed. The largest public high school is Seneca High, with 1,051 students.
| School | Level | Students | Letter |
|---|---|---|---|
| Seneca MiddleLargest public middle schoolGrades 6–8 | Grades 6–8 | 829 | C+ |
| Seneca HighLargest public high schoolGrades 9–12 | Grades 9–12 | 1,051 | A |
NCES · EDFacts · graded within SC on state tests and graduation
Against the 6,473 U.S. towns with household incomes like Seneca’s, it is less healthy than 55%, so its C− isn’t only a matter of income.
Seneca beats the South Carolina average on 0 of 32 CDC measures and trails it on 12. 16% of adults have diabetes in Seneca.
| Seneca | South Carolina towns | U.S. towns | |
|---|---|---|---|
| Diabetes (CDC PLACES) | 16% | 15% | 12% |
| Obesity (CDC PLACES) | 41% | 37% | 35% |
| Frequent physical distress (CDC PLACES) | 16% | 15% | 14% |
| Get no exercise (CDC PLACES) | 31% | 28% | 25% |
| What stands out | Seneca | SC |
|---|---|---|
| More adults with COPD | 9.9% | 7.5% |
| More adults who have had a stroke | 4.9% | 3.9% |
| More adults with heart disease | 8.4% | 6.8% |
CDC PLACES 2025 · modeled estimates for adults · CMS · HRSA
3.8 miles of trail in 5 parks and preserves. The biggest place to walk is Shaver Recreation Complex, 29 acres with 1 miles of trail.
| Seneca | South Carolina towns | U.S. towns | |
|---|---|---|---|
| Miles of trail per square mile | 0.5 miles per square mile | 0.3 | 0.4 |
| Conserved land | 2.5% | 1.7% | 4.3% |
| Biggest places to walk | Trails | Acres |
|---|---|---|
| 1. Shaver Recreation Complex | 1 mi | 29 |
| 2. Blue Ridge Field | 0.3 mi | 4 |
| 3. Gignilliat Community Center | — | 13 |
Trails & parks © OpenStreetMap contributors · Conserved land: USGS PAD-US
Expected storm and flood damage is lower than in 73% of U.S. communities. Since 1989, 3 flood insurance claims have been paid out in Seneca.
FEMA flood insurance claims · FEMA National Risk Index · OpenFEMA
The Clemson Univ weather station, 8 miles away, records that about 55 days a year reach 90°: more than most of the country, but fewer than 76% of South Carolina places with climate records. July afternoons average 89.4°: hotter than most of the country, but cooler than 88% of South Carolina places with climate records; January nights average 32.3°.
Seneca has mild winters and warm summers, with plenty of rain. Seneca’s January low is 32°F. About 2 inches of snow falls in a winter.
| Seneca | South Carolina towns | U.S. towns | |
|---|---|---|---|
| January low | 32°F | 34°F | 22°F |
| July high | 89°F | 91°F | 85°F |
NOAA U.S. Climate Normals, 1991–2020
Seneca has about as many jobs (3,431) as working residents, but only 259 people both live and work here. Jobs based here fell from 5,194 in 2013 to 3,431.
Most working residents leave Seneca for work: only 8% work in town. Since 2013, Seneca has lost 1,763 jobs, to 3,431 in 2023. 4.4% of Seneca workers work from home.
| Seneca | South Carolina towns | U.S. towns | |
|---|---|---|---|
| Work from home | 4.4% | 8.8% | 11% |
| Median household income | $52,000 | $57,000 | $80,000 |
Census LEHD 2023 · ACS
Only 51.4% of households own their home, against 71.9% across South Carolina.
No broad age group is more than 4 points off the South Carolina average. Seneca has grown 6.6% since 2020, to 9,424 residents in the Census Bureau’s 2025 estimate. 29% of adults 25 and older have a bachelor’s degree or more, vs 32% across South Carolina.
| Seneca | South Carolina towns | U.S. towns | |
|---|---|---|---|
| Under 18 | 19% | 22% | 22% |
| Aged 65 or older | 20% | 17% | 18% |
| Bachelor’s degree or more, 25+ | 29% | 23% | 29% |
55% women, 45% men
About 82 men for every 100 women (the survey’s margin: ±3.3 points). Across South Carolina, 51.3% of residents are women.
| Seneca | SC | U.S. | |
|---|---|---|---|
| Under 10 | 11.7% | 11.4% | 11.6% |
| 10 to 17 | 6.8% | 10.1% | 10.3% |
| 18 to 24 | 6.6% | 9.1% | 9.1% |
| 25 to 34 | 18.1% | 12.8% | 13.7% |
| 35 to 44 | 13.3% | 12.5% | 13.2% |
| 45 to 54 | 10.3% | 12% | 12.2% |
| 55 to 64 | 12.8% | 13.2% | 12.7% |
| 65 to 74 | 10.6% | 11.4% | 10.2% |
| 75 and older | 9.8% | 7.4% | 7% |
| No diploma | 13.1% | 9.9% | 10.4% |
| High school | 25% | 28.2% | 26% |
| Some college | 21.3% | 19.8% | 19.1% |
| Associate’s | 11.4% | 10% | 8.8% |
| Bachelor’s | 19.1% | 19.8% | 21.6% |
| Graduate | 10% | 12.3% | 14.1% |
Census population estimates, 2025 · U.S. Census Bureau · ACS 2020-2024 5-year estimates
The typical Seneca home is worth about $305,000, up 1.6% in a year, close to the South Carolina typical home.
| Seneca | South Carolina towns | U.S. towns | |
|---|---|---|---|
| Households that own their home | 51% | 65% | 73% |
| Median rent | $807 a month | $1,062 a month | $1,185 a month |
Zillow Home Value Index · Redfin Data Center
Museums, parks, gardens and other places to visit around Seneca. Close and well known come first.
7 mi Stadium & arenaMemorial Stadium, Clemson
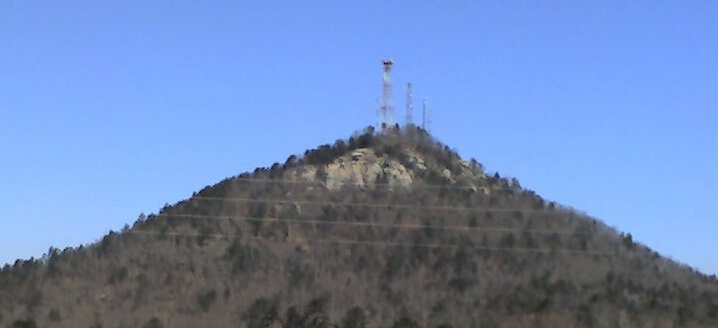
26 mi MountainCurrahee Mountain
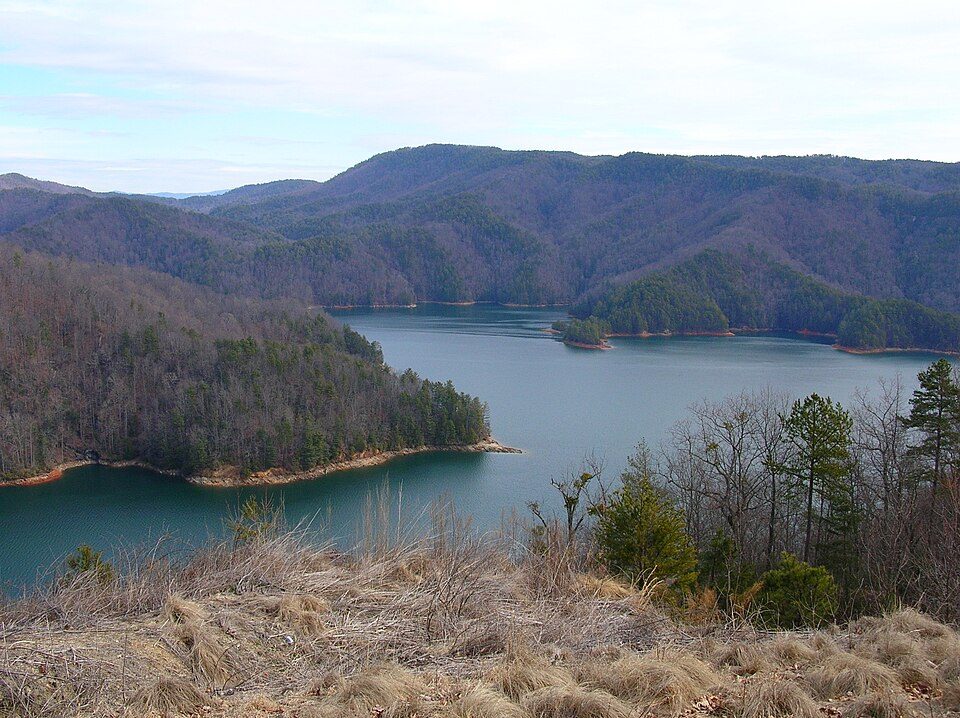
9 mi LakeLake Keowee
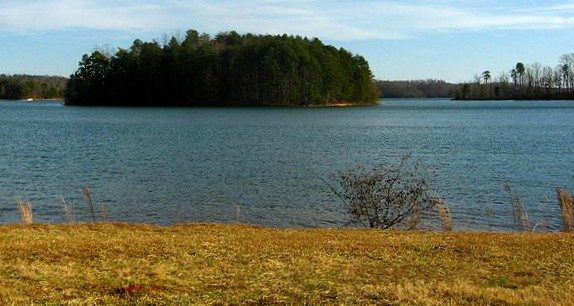
16 mi LakeLake Hartwell
20 mi LakeLake Jocassee23 mi WaterfallTallulah GorgeMemorial Stadium, Clemson: Caseyh at English Wikipedia, CC BY-SA 3.0 · Currahee Mountain: Wikilackey (talk), Public domain · Lake Keowee: Inundated_38Oc1.jpg: Matthew T. Bradley from Berkshire County, Mass., USA deriva, CC BY 2.0 · Lake Hartwell: blahedo, CC BY-SA 2.5 · Lake Jocassee: Clemson3564, Public domain
3 within 15 miles of the center of Seneca
About 5 of every 100 Seneca residents are enrolled in college, about the same as South Carolina.
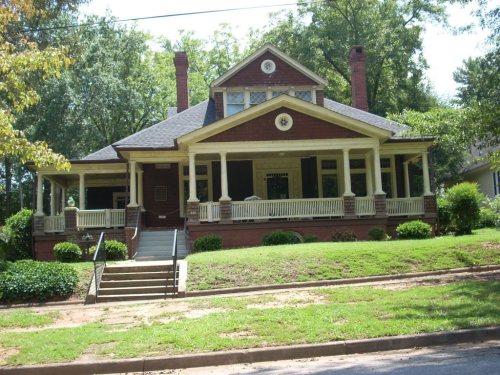
4 places in Seneca on the National Register of Historic Places.
15 notable people were born in Seneca.


City in Oconee County, South Carolina
Seneca is a city in Oconee County, South Carolina, United States. As of the 2020 census, Seneca had a population of 8,850. It is the principal city of the Seneca Micropolitan Statistical Area, which includes all of Oconee County, and is part of the greater Greenville-Spartanburg-Anderson, South Carolina Combined Statistical Area. Seneca was named for the nearby Cherokee town of Isunigu, which English colonists knew as "Seneca Town".
From Wikipedia, licensed CC BY-SA 4.0 · facts via Wikidata (CC0)
One town shares a border with Seneca.
Utica has fewer than 2,500 residents, so it gets subject grades but no overall grade. Utica reports no FBI crime data of its own. Compare Seneca with a neighbor →
Short answers, built from the data on this page.
Seneca grades C− overall, better than 19% of U.S. towns and #120 of 167 in South Carolina. It grades C− for health, C− for safety and B+ for schools. Jobs & income is its weak spot, with a D.
Within South Carolina, it does better than 58% of towns.
Cost of living, which also weighs rents, property taxes and how many households pay 30% or more of their income for housing, grades B−.
15 notable people were born here, including John Edwards and Jimmy Orr.