194 years in pictures
Census counts: 290 in 1880, 24,521 in 2020. The archive holds 6 old photos and papers going back to 1909 and 3 maps from 1968 on.
14 places on the National Register of Historic Places.
- 1832Fort Mill is settled
Each edition grades its towns against each other only.

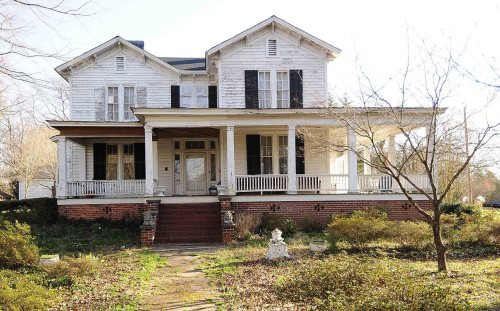
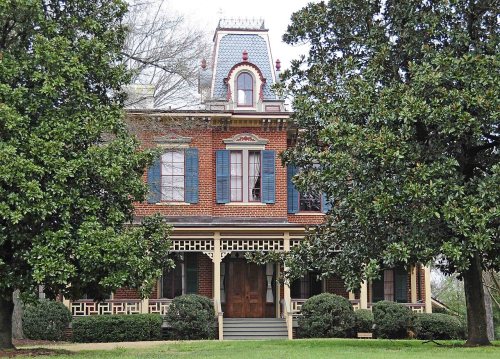
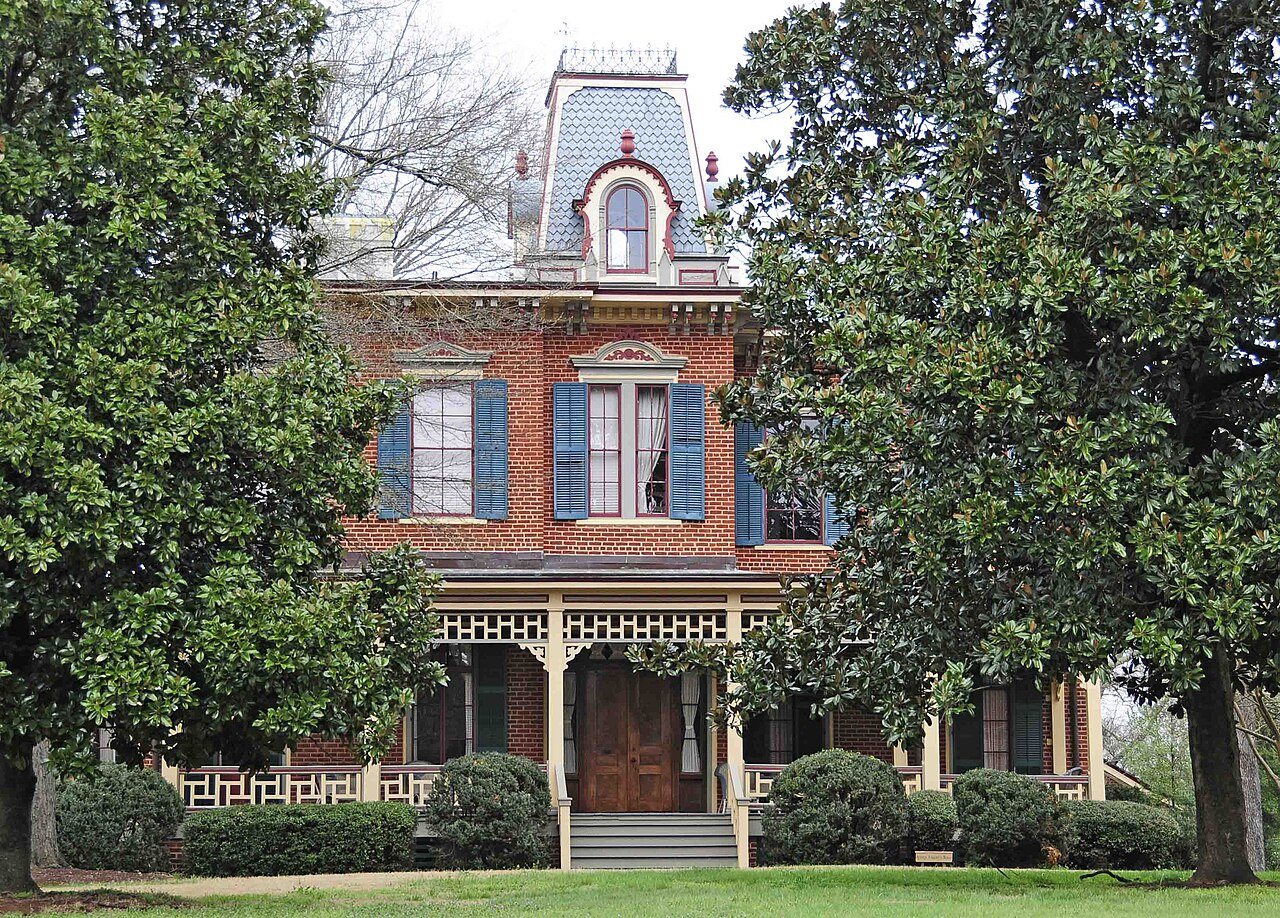
Few places in the country grade higher. Fort Mill earns an A+, 3rd of 167 graded towns in South Carolina. Its schools score near the top of South Carolina on tests and graduation, the median household earns $122K, and it is healthier than 87% of U.S. towns. Its lowest mark, a C, is in cost of living. 58% of adults 25 and older hold a bachelor’s degree or more in Fort Mill, where South Carolina’s towns sit at 23% and U.S. towns at 29%. Only 1 of South Carolina’s 107 towns score higher on safety. Fort Mill has 14 places on the National Register of Historic Places, among them John M. White House and Springfield Plantation House.
Where Fort Mill beats most towns.
Census counts: 290 in 1880, 24,521 in 2020. The archive holds 6 old photos and papers going back to 1909 and 3 maps from 1968 on.
14 places on the National Register of Historic Places.
Each subject compared with towns across the country (schools within South Carolina), ordered by how far Fort Mill is from typical.
How TownRatings grades towns →
Museums, parks, gardens and other places to visit around Fort Mill. Close and well known come first.
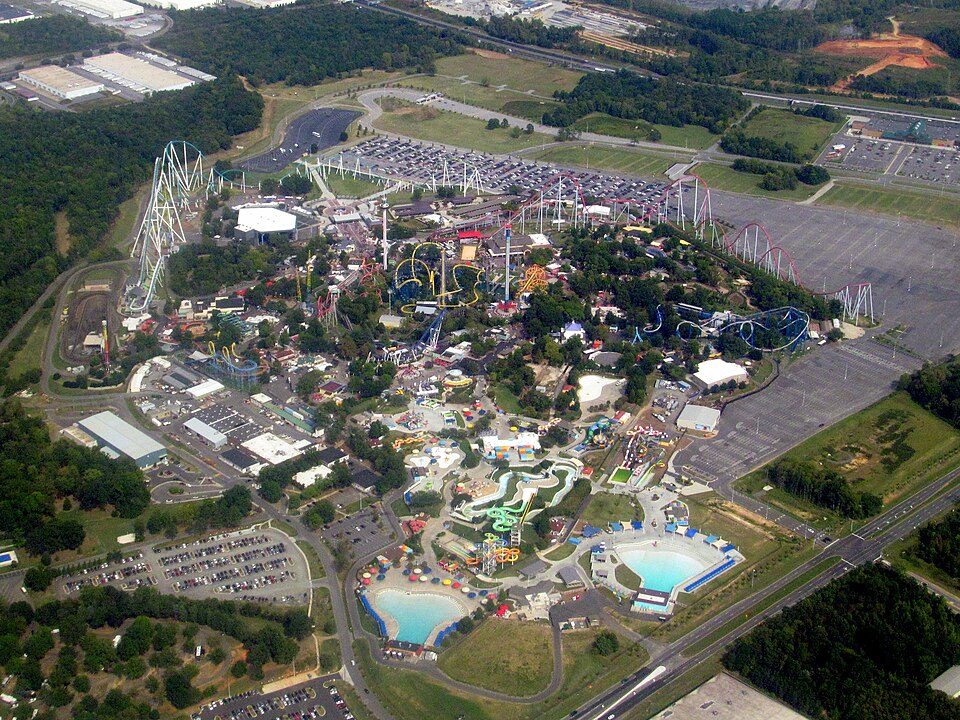
7 mi Theme parkCarowinds
Big draw16 mi Stadium & arenaBank of America Stadium15 mi MuseumSullenberger Aviation Museum70K visitors a year
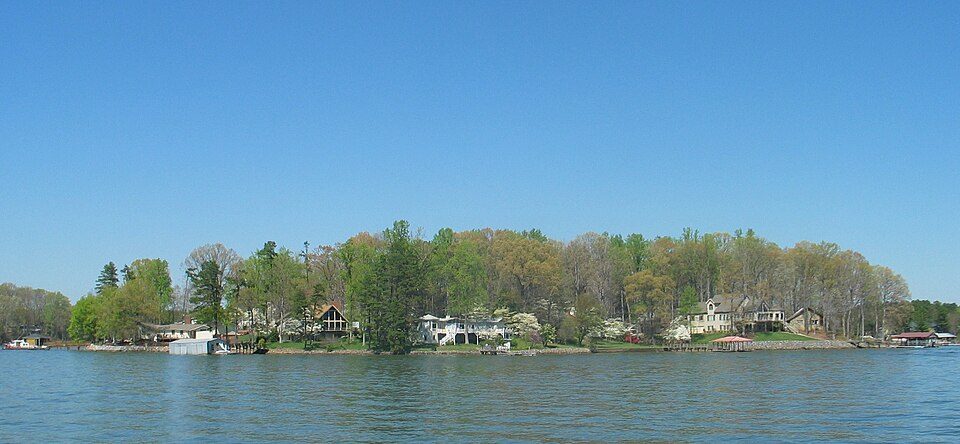
33 mi LakeLake Norman
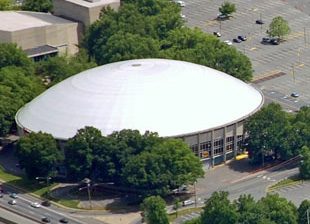
16 mi Stadium & arenaBojangles Coliseum16 mi TheatreOvens AuditoriumCarowinds: Pi.1415926535, CC BY-SA 3.0 · Bank of America Stadium: HangingCurve, CC BY-SA 4.0 · Lake Norman: Prince Grobhelm, CC BY-SA 3.0 · Bojangles Coliseum: James Willamor, CC BY-SA 3.0
Who provides power, water and the rest in Fort Mill, and how to reach them.
EPA SDWIS (Oct 9, 2026) · HIFLD + EIA-861 2025 · Census 2020 ZCTAs · NCES 2024–25 · registration: vote.gov, updated Sep 12, 2025.
Ordered by what stands out in Fort Mill.
Fort Mill has schools in the top 5% of South Carolina, sends many workers across the state line to Pineville and fares better on crime within South Carolina than nationally.
35 miles of trail wind through 13 parks and preserves. The biggest place to walk is Anne Springs Close Greenway, 2,125 acres with 29.3 miles of trail. The concentration of trails for Fort Mill comes to 1.8 miles per square mile.
| Fort Mill | South Carolina towns | U.S. towns | |
|---|---|---|---|
| Miles of trail per square mile | 1.8 miles per square mile | 0.3 | 0.4 |
| Conserved land | 0.7% | 1.8% | 4.3% |
| Biggest places to walk | Trails | Acres |
|---|---|---|
| 1. Anne Springs Close Greenway | 29.3 mi | 2,125 |
| 2. Walter Elisha Park | 0.6 mi | 18 |
| 3. Banks Athletic Park | — | 24 |
Trails & parks © OpenStreetMap contributors · Conserved land: USGS PAD-US
Its A+ ranks #1 of the 169 South Carolina towns we grade for schools.
Three of the 18 schools are below, and why each made the list. The public schools here belong to the York 04 school district. Public school enrollment in Fort Mill: 4,659 students across 6 schools.
| School | Level | Students | Letter |
|---|---|---|---|
| Pleasant Knoll MiddleLargest public middle schoolGrades 6–8 | Grades 6–8 | 916 | A |
| Fort Mill HighLargest public high schoolGrades 9–12 | Grades 9–12 | 2,115 | A+ |
| Nation Ford HighTop results in townGrades 9–12 | Grades 9–12 | 1,921 | A+ |
NCES · EDFacts · graded within SC on state tests and graduation
At 6.2 years of the Charlotte metro’s $83K median household income, the typical home (about $519K) costs more against local pay than in 94% of South Carolina towns; that ratio is one input to its C for cost of living. The median property tax bill is $3,385, against $1,251 across South Carolina, another input to its cost-of-living grade.
Values fell 1.6% in the year to September 2026. Among households in Fort Mill, 83% live in a home they own. The town’s typical rent stands at $1,503 a month.
| Fort Mill | South Carolina towns | U.S. towns | |
|---|---|---|---|
| Households that own their home | 83% | 65% | 73% |
| Median rent | $1,503 a month | $1,058 a month | $1,185 a month |
Census ACS, 2020–24 · Zillow Home Value Index · Redfin Data Center
Its widest gap with South Carolina is tooth loss: 8.1% of those 65+ have lost all their teeth, against 13.9% statewide. Against the 5,476 U.S. towns with household incomes like Fort Mill’s, it is healthier than 70%, a smaller edge than it has nationally: part of it comes with its incomes.
Only 10 of the 169 South Carolina towns we compare have a lower share of adults who have diabetes than Fort Mill. Fort Mill: 11% of adults report frequent physical distress. Against the South Carolina average, Fort Mill comes out ahead on 20 CDC measures out of 32, and behind on 1. Among adults locally, 28% feel lonely and 14% say their health is fair or poor.
| Fort Mill | South Carolina towns | U.S. towns | |
|---|---|---|---|
| Frequent physical distress (CDC PLACES) | 11% | 15% | 14% |
| Feel lonely (CDC PLACES) | 28% | 33% | 33% |
| Fair or poor health (CDC PLACES) | 14% | 23% | 19% |
| Diabetes (CDC PLACES) | 9.7% | 15% | 12% |
| What stands out | Fort Mill | SC |
|---|---|---|
| Fewer older adults who have lost all their teeth | 8.1% | 13.9% |
| Fewer adults facing food insecurity | 11% | 17.4% |
| Fewer adults treating high blood pressure | 76.7% | 80.2% |
CDC PLACES 2025 · modeled estimates for adults · CMS · HRSA
At 7.8 crimes per 1,000 residents a year, it reports less crime than 99% of South Carolina’s graded towns. Reported crimes fell from 230 to 219 over the last three FBI years, a drop beyond ordinary year-to-year swings.
In Fort Mill, the violent crime rate is 0.3 per 1,000 residents. The town reports less crime per resident than just over four fifths of the U.S. towns and cities we grade.
| Fort Mill | South Carolina towns | U.S. towns | |
|---|---|---|---|
| Violent crimes per 1,000 (2025) | 0.3 per 1,000 residents | 4.3 | 1.6 |
| Property crimes per 1,000 (2025) | 5.2 per 1,000 residents | 21.7 | 9.9 |
FBI crime data, 2025 · crimes reported to police
January nights average 31.1°: milder than most of the country, but colder than 91% of South Carolina places with climate records; July afternoons average 90.5°.
Fort Mill’s July high comes in at 91°F. Snow almost never falls.
| Fort Mill | South Carolina towns | U.S. towns | |
|---|---|---|---|
| January low | 31°F | 34°F | 22°F |
| July high | 91°F | 91°F | 85°F |
NOAA U.S. Climate Normals, 1991–2020
30% of working residents cross a state line to work, Pineville among the top destinations. Jobs based here grew from 5,989 in 2013 to 14,455.
Since 2013, Fort Mill has added 8,466 jobs, to 14,455 in 2023. 4.8% of residents live below the poverty line locally. Only 15% of working residents stay in Fort Mill for work; the rest commute out. The top destinations are Charlotte (30%), Rock Hill (9%) and Columbia (2%).
| Fort Mill | South Carolina towns | U.S. towns | |
|---|---|---|---|
| Work from home | 28% | 8.6% | 11% |
| Median household income | $122,000 | $57,000 | $80,000 |
| Below the poverty line | 4.8% | 17% | 9.6% |
| Working residents who work in town | 15% | 6.1% | 8% |
Census LEHD 2023 · ACS
One flood insurance claim has been paid in Fort Mill since 1997. Compared with 58% of U.S. communities, expected storm and flood damage locally is higher. Expected losses in Fort Mill break down as 69% from inland flooding and 17% from tornadoes. Federal aid has come to Fort Mill households in 4 declared disasters; the latest was in 2024.
FEMA flood insurance claims · FEMA disaster declarations and aid · FEMA National Risk Index · OpenFEMA
6 within 15 miles of the center of Fort Mill
About 3 of every 100 Fort Mill residents are enrolled in college, against 6 across South Carolina.
10,811 counted in 2010 and 24,521 in 2020; an estimated 38,673 in 2025.
Growth hasn’t slowed: 57.7% since 2020, after 126.8% in the decade before.
U.S. Census 2010 & 2020 counts · Census Bureau estimate, July 1, 2025
14 places in Fort Mill on the National Register of Historic Places.
7 notable people were born in Fort Mill.


Town in South Carolina, United States
Fort Mill, also known as Fort Mill Township, is a town in York County, South Carolina, United States. It is a suburb of Charlotte, North Carolina. As of the 2020 census, the population of the town was 24,521. Some businesses and residents in the Indian Land community of neighboring Lancaster County share a Fort Mill mailing address, but the official town boundary extends only within York County.
From Wikipedia, licensed CC BY-SA 4.0 · facts via Wikidata (CC0)
2 towns share a border with Fort Mill.
| Town | SC rank | Overall | Cost | Safety | Schools | Health |
|---|---|---|---|---|---|---|
| Fort Mill | #3 | A+ | C | A− | A+ | A |
| Riverview | — | — | A− | — | A+ | A |
| Baxter Village | #2 | A+ | C+ | — | A+ | A |
Riverview has fewer than 2,500 residents, so it gets subject grades but no overall grade. Riverview and Baxter Village report no FBI crime data of their own. Compare Fort Mill with a neighbor →
Short answers, built from the data on this page.
Yes, by almost any measure. Fort Mill grades A+ overall, better than 95% of U.S. towns and #3 of 167 in South Carolina. It grades A for health, A− for safety and A+ for schools.
That is 6.2 years of the area's median household income ($83,304 across the Charlotte-Concord-Gastonia, NC-SC metro area). Cost of living, which also weighs rents, property taxes and how many households pay 30% or more of their income for housing, grades C.
7 notable people were born here, including James E. Williams and Ernest Dixon.