SummersideOH
A town of 4,662.
Is Summerside a good place to live?
Summerside gives you more for your money than most places: homes are within reach, about $261K for a typical one, or 3.2 years of the Cincinnati metro’s $81K median household income. It grades C overall, 787th among Ohio's 987 graded towns. On the plus side, natural-hazard risk is low. Most errands need a car: it is less walkable than 91% of U.S. towns. Only 16 of Ohio’s 1,718 towns score lower on history. The biggest place to walk is Clepper Park, 48 acres with 1.2 miles of trail.
What makes Summerside stand out
Where Summerside beats most towns.
99% of working residents leave Summerside for work
Where Summerside’s working residents go each day. Line width shows the share.
Census LEHD 2023
How Summerside grades
Each subject compared with towns across the country (schools within Ohio), ordered by how far Summerside is from typical.
Its grades run from A+ for hazard risk (better than 98% of comparable towns) to D for walkability (better than 9%), so the C overall blends very different results.
How TownRatings grades towns →
Kings Island and 54 more within 40 miles
Museums, parks, gardens and other places to visit around Summerside. Close and well known come first.
 Big draw16 mi Theme parkKings Island3.5M visitors a year
 13 mi Stadium & arenaPaycor Stadium
 Big draw38 mi Theme parkArk Encounter
 12 mi Stadium & arenaGreat American Ball Park
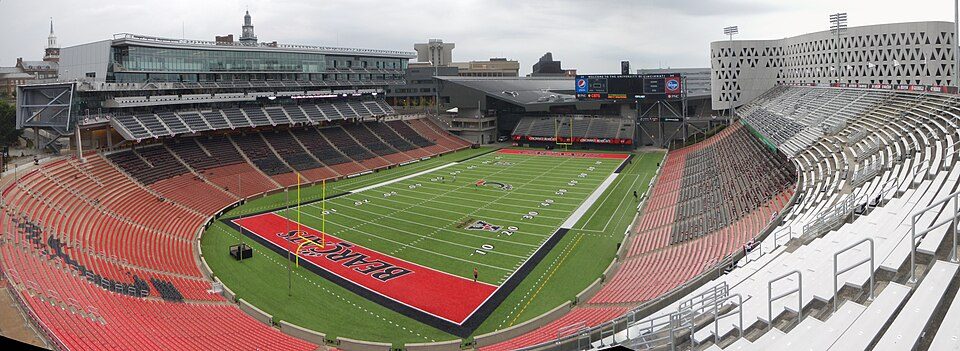 13 mi Stadium & arenaNippert Stadium
 13 mi Stadium & arenaTQL Stadium
Photo credits
Kings Island: Eli Duke from Portland, OR, USA, CC BY-SA 2.0 · Paycor Stadium: JonRidinger, CC BY-SA 4.0 · Ark Encounter: OlinEJ, CC0 · Great American Ball Park: Eric Kilby profile at Flickr website, CC BY-SA 2.0 · Nippert Stadium: Ben Levin, CC BY-SA 4.0 · TQL Stadium: Cornfield948, CC BY-SA 3.0


Moving to Summerside: who provides what
Summerside is unincorporated, so Clermont County and regional agencies provide most services.
EPA SDWIS (Oct 9, 2026) · HIFLD + EIA-861 2025 · Census 2020 ZCTAs · NCES 2024–25 · registration: vote.gov, updated Aug 3, 2026.
The data
Ordered by what stands out in Summerside.
Protected land: 3.8% of Summerside
In Summerside, the density of trails is 0.6 miles per square mile, against 0.2 in Ohio’s towns and 0.4 across U.S. towns.
| Summerside | Ohio towns | U.S. towns | |
|---|---|---|---|
| Miles of trail per square mile | 0.6 miles per square mile | 0.2 | 0.4 |
| Conserved land | 3.8% | 3.7% | 4.3% |
| Biggest places to walk | Trails | Acres |
|---|---|---|
| 1. Clepper Park | 1.2 mi | 48 |
Trails & parks © OpenStreetMap contributors · Conserved land: USGS PAD-US
Summerside stands out in Ohio and nationally, with the FEMA risk score lower than most
FEMA puts 34% of Summerside’s expected hazard losses down to inland flooding, and 18% to cold waves. Expected storm and flood damage is lower than in 96% of U.S. communities.
FEMA National Risk Index · OpenFEMA
Compared with most of Ohio and the rest of the country, fewer of Summerside’s working residents work locally
Summerside has 635 jobs for its 2,320 working residents: even if every job went to a resident, most would still commute out. Jobs based here grew from 468 in 2013 to 635.
Half the trips to work are shorter than 12 miles. Summerside had 635 jobs in 2023, up 167 from 2013. The share of residents in Summerside who live below the poverty line is 17%, where Ohio’s towns sit at 9.1% and U.S. towns at 9.6%. For Summerside, the average commute is 26 minutes.
| Summerside | Ohio towns | U.S. towns | |
|---|---|---|---|
| Below the poverty line | 17% | 9.1% | 9.6% |
| Working residents who work in town | 0.6% | 6.9% | 8% |
| Average trip to work | 26 minutes | 24 minutes | 25 minutes |
| Median household income | $71,000 | $75,000 | $80,000 |
Where working residents work
Census LEHD 2023 · ACS
On CDC estimates, Summerside is less healthy than 71% of U.S. towns
35% of adults feel lonely in Summerside. Among adults here, 18% smoke cigarettes and 19% report frequent mental distress.
| Summerside | Ohio towns | U.S. towns | |
|---|---|---|---|
| Depression (CDC PLACES) | 28% | 26% | 23% |
| Smoke cigarettes (CDC PLACES) | 18% | 16% | 14% |
| Frequent mental distress (CDC PLACES) | 19% | 18% | 17% |
| Binge drink (CDC PLACES) | 18% | 17% | 16% |
| What stands out | Summerside | OH |
|---|---|---|
| Fewer adults seeing a dentist | 58.4% | 62.9% |
CDC PLACES 2025 · modeled estimates for adults · CMS · HRSA
In Summerside, expect four seasons and pleasant summers
Summer afternoons peak near 86° in July, and January nights bottom out around 23°; snowfall runs to about 16 inches a winter. Expect chilly winters and warm summers in Summerside.
Typical low → high °F
NOAA U.S. Climate Normals, 1991–2020
More young adults than Ohio overall
For residents in Summerside, the share who are 65 or older is 16%. Adults 18 to 34 are 30% of residents (22% statewide); adults 35 to 64 are 33% of residents (38% statewide). Its midpoint age stands at 34.5 years. College graduates make up 30% of adults 25 and older, against 32% across Ohio.
| Summerside | Ohio towns | U.S. towns | |
|---|---|---|---|
| Median age | 34.5 years | 41.7 years | 40.5 years |
| Aged 65 or older | 16% | 20% | 18% |
| Bachelor’s degree or more, 25+ | 30% | 24% | 29% |
Ages · share of residents
Education · adults 25 and older
Women and men · all residents
54% women, 46% men
About 84 men for every 100 women (the survey’s margin: ±2.9 points). Across Ohio, 50.7% of residents are women.
| Summerside | OH | U.S. | |
|---|---|---|---|
| Under 10 | 16.7% | 11.7% | 11.6% |
| 10 to 17 | 4.9% | 10.3% | 10.3% |
| 18 to 24 | 10% | 8.9% | 9.1% |
| 25 to 34 | 19.5% | 13.2% | 13.7% |
| 35 to 44 | 9.6% | 12.5% | 13.2% |
| 45 to 54 | 5.1% | 12% | 12.2% |
| 55 to 64 | 18.4% | 13.2% | 12.7% |
| 65 to 74 | 6.6% | 10.9% | 10.2% |
| 75 and older | 9.3% | 7.3% | 7% |
| No diploma | 9.3% | 8.2% | 10.4% |
| High school | 34.1% | 32.1% | 26% |
| Some college | 14.6% | 19.3% | 19.1% |
| Associate’s | 11.7% | 9% | 8.8% |
| Bachelor’s | 22.2% | 19.3% | 21.6% |
| Graduate | 8% | 12.2% | 14.1% |
U.S. Census Bureau · ACS 2020-2024 5-year estimates · in a town of 4,700, single groups can be off by several points
Summerside’s grade for cost of living is a B
Homes sold in Summerside spent a median 51 days on the market. The typical Summerside home is worth about $261,000, up 2.6% in a year, 6% above the Ohio typical home. In Summerside, nearly two thirds of households own their home.
| Summerside | Ohio towns | U.S. towns | |
|---|---|---|---|
| Households that own their home | 65% | 77% | 73% |
| Median rent | $1,177 a month | $943 a month | $1,185 a month |
Typical home value
Zillow Home Value Index · Redfin Data Center
Everything we know about Summerside
Colleges nearby
14 within 15 miles of the center of Summerside
About 3 of every 100 Summerside residents are enrolled in college, against 6 across Ohio.
About Summerside
Census-designated place in Ohio, United States
Summerside is a census-designated place (CDP) in Union Township, Clermont County, Ohio, United States. Its population was 4,941 as of the 2020 census.
From Wikipedia, licensed CC BY-SA 4.0 · facts via Wikidata (CC0)
- Area
- 2.1 sq mi
- Elevation
- 879 ft
Summerside’s neighbors
One town shares a border with Summerside.
| Town | OH rank | Overall | Cost | Safety | Schools | Health |
|---|---|---|---|---|---|---|
| Summerside | #787 | C | B | — | B− | C |
| Mount Carmel | #532 | B | B+ | — | B− | C |
Summerside and Mount Carmel report no FBI crime data of their own. Compare Summerside with a neighbor →
Questions about Summerside
Short answers, built from the data on this page.
Is Summerside, OH a good place to live?
Summerside grades C overall, better than 33% of U.S. towns and #787 of 987 in Ohio. It grades C for health and B− for schools. Walkability is its weak spot, with a D.
Is Summerside, OH expensive?
Cost of living, which also weighs rents, property taxes and how many households pay 30% or more of their income for housing, grades B.