
Heron Ridge, Morrow Ohio, December 2010, 2010
Morrow’s story
181 years in pictures
The archive holds 6 old photos and papers going back to 2004.
- 1845Morrow is settled
Each edition grades its towns against each other only.

Morrow’s best subject grade is an A− for schools; its weakest is a D for walkability. Morrow’s average trip to work is 39 minutes, above both the Ohio town median (24 minutes) and the median of U.S. towns (25 minutes). The biggest park or preserve is Thornton Park, at 57 acres. Morrow has fewer than 2,500 residents, so it gets subject grades but no overall grade.
Where Morrow beats most towns.
1,188 counted in 2010 and 2,049 in 2020; an estimated 2,223 in 2025.
U.S. Census 2010 & 2020 counts · Census Bureau estimate, July 1, 2025
Each subject compared with towns across the country (schools within Ohio), ordered by how far Morrow is from typical.
How TownRatings grades towns →
The archive holds 6 old photos and papers going back to 2004.
Museums, parks, gardens and other places to visit around Morrow. Close and well known come first.
 Big draw8 mi Theme parkKings Island3.5M visitors a year
 30 mi MuseumNational Museum of the United States Air Force1.0M visitors a year
 27 mi Stadium & arenaPaycor Stadium
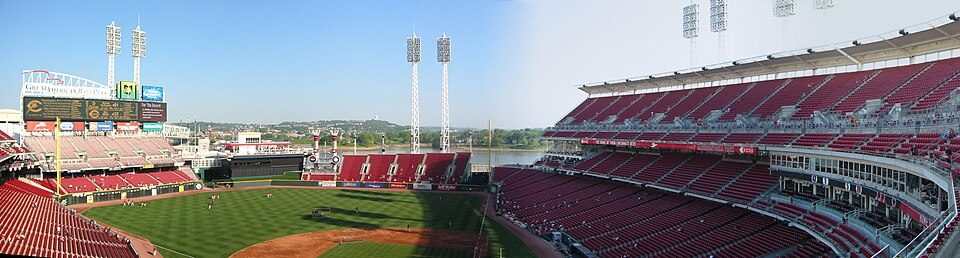 27 mi Stadium & arenaGreat American Ball Park
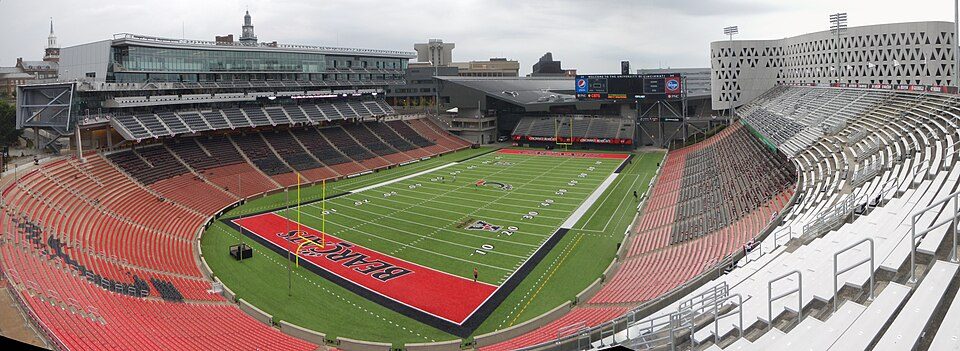 26 mi Stadium & arenaNippert Stadium
 25 mi Zoo & aquariumCincinnati Zoo and Botanical Garden1.2M visitors a year
Kings Island: Eli Duke from Portland, OR, USA, CC BY-SA 2.0 · National Museum of the United States Air Force: No machine-readable author provided. Rogerd assumed (based on copyright claims)., CC BY-SA 3.0 · Paycor Stadium: JonRidinger, CC BY-SA 4.0 · Great American Ball Park: Eric Kilby profile at Flickr website, CC BY-SA 2.0 · Nippert Stadium: Ben Levin, CC BY-SA 4.0 · Cincinnati Zoo and Botanical Garden: Unknown, CC BY-SA 2.5
Who provides power, water and the rest in Morrow, and how to reach them.
EPA SDWIS (Oct 9, 2026) · HIFLD + EIA-861 2025 · Census 2020 ZCTAs · NCES 2024–25 · registration: vote.gov, updated Aug 3, 2026.
Ordered by what stands out in Morrow.
Values rose 2.1% in the 12 months to September 2026. Homes sold in Morrow spent a median 61 days on the market. For Morrow, the rent at the middle of the market is $1,078 a month.
| Morrow | Ohio towns | U.S. towns | |
|---|---|---|---|
| Households that own their home | 78% | 77% | 73% |
| Median rent | $1,078 a month | $944 a month | $1,185 a month |
Census ACS, 2020–24 · Zillow Home Value Index · Redfin Data Center
6.6% of residents live below the poverty line in Morrow, against 9.1% in Ohio’s towns and 9.6% across U.S. towns. Commuting out is the norm here: 2% of working residents work locally. This Ohio town had 342 jobs in 2023, down 33 from 2013. The median commute is under 16 miles.
| Morrow | Ohio towns | U.S. towns | |
|---|---|---|---|
| Working residents who work in town | 2.3% | 6.9% | 8% |
| Below the poverty line | 6.6% | 9.1% | 9.6% |
| Median household income | $82,000 | $75,000 | $80,000 |
Census LEHD 2023 · ACS
Among residents in Morrow, 31% are under 18. Children under 18 are 31% of residents (22% statewide); people 65 and older are 11% of residents (18% statewide). For Morrow, the median age is 31.9 years. The town has grown 8.4% since 2020, to 2,223 residents in the Census Bureau’s 2025 estimate.
| Morrow | Ohio towns | U.S. towns | |
|---|---|---|---|
| Under 18 | 31% | 22% | 22% |
| Median age | 31.9 years | 41.7 years | 40.5 years |
| Aged 65 or older | 11% | 20% | 18% |
| Bachelor’s degree or more, 25+ | 35% | 24% | 29% |
49% women, 51% men
That’s an even split within the survey’s margin of ±2.2 points. Across Ohio, 50.7% of residents are women.
| Morrow | OH | U.S. | |
|---|---|---|---|
| Under 10 | 16.9% | 11.7% | 11.6% |
| 10 to 17 | 13.8% | 10.3% | 10.3% |
| 18 to 24 | 6.7% | 8.9% | 9.1% |
| 25 to 34 | 17.3% | 13.2% | 13.7% |
| 35 to 44 | 17.6% | 12.5% | 13.2% |
| 45 to 54 | 8.4% | 12% | 12.2% |
| 55 to 64 | 8.4% | 13.2% | 12.7% |
| 65 to 74 | 8.9% | 10.9% | 10.2% |
| 75 and older | 2% | 7.3% | 7% |
| No diploma | 4.9% | 8.2% | 10.4% |
| High school | 28% | 32.1% | 26% |
| Some college | 18.5% | 19.3% | 19.1% |
| Associate’s | 13.3% | 9% | 8.8% |
| Bachelor’s | 25.3% | 19.3% | 21.6% |
| Graduate | 9.9% | 12.2% | 14.1% |
Census population estimates, 2025 · U.S. Census Bureau · ACS 2020-2024 5-year estimates · in a town of 2,200, single groups can be off by several points
Winters in Morrow are chilly and summers warm. Summer afternoons peak near 86° in July, and January nights bottom out around 22°; snowfall runs to about 14 inches a winter.
NOAA U.S. Climate Normals, 1991–2020
Expected losses in Morrow break down as 76% from inland flooding and 8% from tornadoes. Its FEMA risk score stands at 61 of 100. Since 1978, Morrow has seen 17 flood insurance claims paid out.
FEMA flood insurance claims · FEMA National Risk Index · OpenFEMA
In Morrow, just over a quarter of adults have been diagnosed with depression. The town does better than the Ohio average on 5 of 32 CDC measures and worse on 1. Two figures for adults here: 31% have high blood pressure, 11% have diabetes.
| Morrow | Ohio towns | U.S. towns | |
|---|---|---|---|
| Binge drink (CDC PLACES) | 19% | 17% | 16% |
| High blood pressure (CDC PLACES) | 31% | 38% | 35% |
| Diabetes (CDC PLACES) | 11% | 13% | 12% |
| Get no exercise (CDC PLACES) | 23% | 28% | 25% |
| What stands out | Morrow | OH |
|---|---|---|
| Fewer adults who have had a stroke | 2.9% | 3.7% |
| Fewer adults with diabetes | 10.6% | 13.2% |
| Fewer adults treating high blood pressure | 76.3% | 79.2% |
CDC PLACES 2025 · modeled estimates for adults · CMS · HRSA
Trails run 0.2 miles in 4 parks and preserves. Morrow’s trail density comes in at 0.1 miles per square mile.
| Morrow | Ohio towns | U.S. towns | |
|---|---|---|---|
| Conserved land | 7% | 3.7% | 4.3% |
| Miles of trail per square mile | 0.1 miles per square mile | 0.2 | 0.4 |
| Biggest places to walk | Trails | Acres |
|---|---|---|
| 1. Thornton Park | 0.1 mi | 57 |
| 2. Morrow Veterans Memorial Park | — | 31 |
| 3. Little Miami State Park | — | 23 |
Trails & parks © OpenStreetMap contributors · Conserved land: USGS PAD-US
2 within 15 miles of the center of Morrow
About 4 of every 100 Morrow residents are enrolled in college, against 6 across Ohio.
Where Morrow’s working residents go each day. Line width shows the share.
Census LEHD 2023
Village in Ohio, United States
Morrow is a village in Salem Township, Warren County, Ohio, United States. The population was 2,049 at the 2020 census.
From Wikipedia, licensed CC BY-SA 4.0 · facts via Wikidata (CC0)
One town shares a border with Morrow.
| Town | OH rank | Overall | Cost | Safety | Schools | Health |
|---|---|---|---|---|---|---|
| Morrow | — | — | B | — | A− | B |
| Roachester | — | — | — | — | — | — |
Morrow has fewer than 2,500 residents, so it gets subject grades but no overall grade. Morrow reports no FBI crime data of its own. Roachester isn’t graded (fewer than 1,000 residents, or not enough data). Compare Morrow with a neighbor →
Short answers, built from the data on this page.
That is 4.9 years of the area's median household income ($81,120 across the Cincinnati, OH-KY-IN metro area). Cost of living, which also weighs rents, property taxes and how many households pay 30% or more of their income for housing, grades B.
2 notable people were born here, including Merie Earle and Robert Hardy Small.


