
Lake Katharine-21, 2012
Liberty Township’s story
Liberty Township in pictures
The archive holds 4 old photos and papers going back to 2012 and 4 maps from 1913 on.
Explore the history →Each edition grades its towns against each other only.
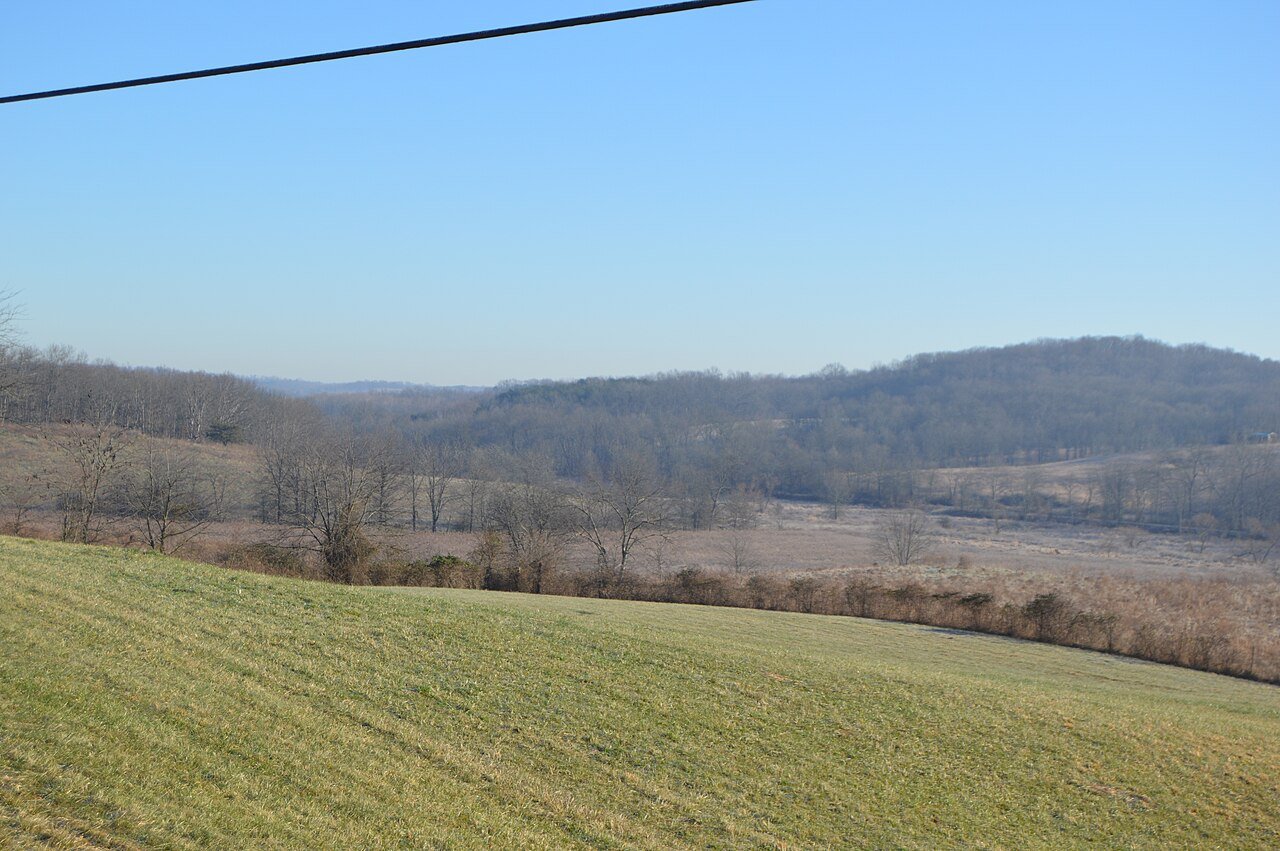
A town of 1,788. 58% more nonprofits per person than the typical Ohio town.
The best of Liberty Township’s subject grades is an A− for civic life; the weakest is a D for health. Liberty Township’s average trip to work is 41 minutes, where Ohio’s towns sit at 24 minutes and U.S. towns at 25 minutes. Only 160 of Ohio’s 1,718 towns score lower on health. Most errands need a car: it is less walkable than 88% of U.S. towns. Only 13 of Ohio’s 1,718 towns score lower on history. Liberty Township has fewer than 2,500 residents, so it gets subject grades but no overall grade.
Where Liberty Township beats most towns, and one thing worth knowing.
Where Liberty Township’s working residents go each day. Line width shows the share.
Census LEHD 2023
Each subject compared with towns across the country (schools within Ohio), ordered by how far Liberty Township is from typical.
How TownRatings grades towns →
The archive holds 4 old photos and papers going back to 2012 and 4 maps from 1913 on.
Explore the history →Who provides power, water and the rest in Liberty Township, and how to reach them.
EPA SDWIS (Oct 9, 2026) · HIFLD + EIA-861 2025 · Census 2020 ZCTAs · NCES 2024–25 · registration: vote.gov, updated Aug 3, 2026.
Ordered by what stands out in Liberty Township.
Liberty Township beats the Ohio average on 0 of 32 CDC measures and trails it on 14. 45% of Liberty Township adults have obesity, above both Ohio’s towns (38%) and U.S. towns (35%). 20% of adults smoke cigarettes in Liberty Township.
| Liberty Township | Ohio towns | U.S. towns | |
|---|---|---|---|
| Obesity (CDC PLACES) | 45% | 38% | 35% |
| Smoke cigarettes (CDC PLACES) | 20% | 16% | 14% |
| Depression (CDC PLACES) | 29% | 26% | 23% |
| Get no exercise (CDC PLACES) | 34% | 28% | 25% |
| What stands out | Liberty Township | OH |
|---|---|---|
| More adults with COPD | 10.6% | 8% |
| More smokers | 20% | 15.4% |
| More older adults who have lost all their teeth | 19.3% | 15.3% |
CDC PLACES 2025 · modeled estimates for adults · CMS · HRSA
Adults 35 to 64 are 52% of residents (38% statewide); people 65 and older are 13% of residents (18% statewide). Liberty Township’s median age is 50.2 years. 24% of adults 25 and older have a bachelor’s degree or more, vs 32% across Ohio.
| Liberty Township | Ohio towns | U.S. towns | |
|---|---|---|---|
| Median age | 50.2 years | 41.7 years | 40.5 years |
| Bachelor’s degree or more, 25+ | 24% | 24% | 29% |
48% women, 52% men
That’s an even split within the survey’s margin of ±7.5 points. Across Ohio, 50.7% of residents are women.
| Liberty Township | OH | U.S. | |
|---|---|---|---|
| Under 10 | 13% | 11.7% | 11.6% |
| 10 to 17 | 4.7% | 10.3% | 10.3% |
| 18 to 24 | 9.5% | 8.9% | 9.1% |
| 25 to 34 | 8% | 13.2% | 13.7% |
| 35 to 44 | 10.6% | 12.5% | 13.2% |
| 45 to 54 | 15.9% | 12% | 12.2% |
| 55 to 64 | 25.2% | 13.2% | 12.7% |
| 65 to 74 | 8.3% | 10.9% | 10.2% |
| 75 and older | 4.8% | 7.3% | 7% |
| No diploma | 3.6% | 8.2% | 10.4% |
| High school | 26.8% | 32.1% | 26% |
| Some college | 17.1% | 19.3% | 19.1% |
| Associate’s | 28.2% | 9% | 8.8% |
| Bachelor’s | 19.4% | 19.3% | 21.6% |
| Graduate | 4.8% | 12.2% | 14.1% |
U.S. Census Bureau · ACS 2020-2024 5-year estimates · in a town of 1,800, single groups can be off by several points
Most working residents leave Liberty Township for work: only 1% work in town. Jobs based in Liberty Township fell to 78 in 2023, 44 fewer than in 2013. The median household income in Liberty Township is $65,000.
| Liberty Township | Ohio towns | U.S. towns | |
|---|---|---|---|
| Below the poverty line | 13% | 9.1% | 9.6% |
| Working residents who work in town | 1.5% | 6.9% | 8% |
| Median household income | $65,000 | $75,000 | $80,000 |
Census LEHD 2023 · ACS
Expected storm and flood damage is lower than in 74% of U.S. communities. Since 1997, 46 flood insurance claims have been paid out in Liberty Township.
FEMA flood insurance claims · FEMA National Risk Index · OpenFEMA
Liberty Township has chilly winters and warm summers. July afternoons reach 85°, January nights drop to 23° and about 21 inches of snow falls in a winter.
NOAA U.S. Climate Normals, 1991–2020
3.5 miles of trail in 0 parks and preserves.
| Liberty Township | Ohio towns | U.S. towns | |
|---|---|---|---|
| Conserved land | 8.7% | 3.7% | 4.3% |
| Miles of trail per square mile | 0.1 miles per square mile | 0.2 | 0.4 |
Trails & parks © OpenStreetMap contributors · Conserved land: USGS PAD-US
None within 15 miles of Liberty Township; the nearest are
About 2 of every 100 Liberty Township residents are enrolled in college, against 6 across Ohio.
Township in Ohio, US
Liberty Township is one of the twelve townships of Jackson County, Ohio, United States. As of the 2020 census, 1,811 people lived in the township.
From Wikipedia, licensed CC BY-SA 4.0 · facts via Wikidata (CC0)
6 towns share a border with Liberty Township.
| Town | OH rank | Overall | Cost | Safety | Schools | Health |
|---|---|---|---|---|---|---|
| Liberty Township | — | — | B | — | B+ | D |
| Jackson | #763 | C+ | B+ | C− | B+ | D |
| Jackson Township | — | — | A− | — | B+ | D |
| Lick Township | #853 | C | B− | — | B+ | D |
| Scioto Township | — | — | A− | — | B+ | D |
| Coal Township | — | — | A | — | C+ | D− |
| Beaver Township | — | — | C+ | — | B | D− |
Liberty Township, Jackson Township, Scioto Township, Coal Township and Beaver Township have fewer than 2,500 residents, so they get subject grades but no overall grade. Liberty Township, Jackson Township, Lick Township, Scioto Township, Coal Township and Beaver Township report no FBI crime data of their own. Compare Liberty Township with a neighbor →
Short answers, built from the data on this page.
58% more nonprofits per person than the typical Ohio town.
Cost of living, which also weighs rents, property taxes and how many households pay 30% or more of their income for housing, grades B.