151 years in pictures
Census counts: 691 in 1890, 5,657 in 2020. The archive holds 6 old photos and papers going back to 1887 and 4 maps from 1902 on.
- 1875Washingtonville is settled
Each edition grades its towns against each other only.

A town of 5,640, settled in 1875.
Washingtonville grades A− overall, 161st among New York's 745 graded towns, with clear strengths and some subjects that lag. It is healthier than 85% of U.S. towns and crime is low: it reports less per resident than 83% of U.S. towns. It also does better than most on incomes: the median household earns $95K. Its lowest everyday mark is in cost of living: the typical home is worth about $530K, 5.4 years of the Kiryas Joel metro’s $98K median household income. Washingtonville’s average trip to work is 39 minutes, against 25 minutes in New York’s towns and 25 minutes across U.S. towns. Washingtonville is easier to get around on foot or by transit than 92% of U.S. towns. On history, just 50 of New York’s 1,216 towns do worse.
Where Washingtonville beats most towns.
Where Washingtonville’s working residents go each day. Line width shows the share.
Census LEHD 2023
Each subject compared with towns across the country (schools within New York), ordered by how far Washingtonville is from typical.
How TownRatings grades towns →
Census counts: 691 in 1890, 5,657 in 2020. The archive holds 6 old photos and papers going back to 1887 and 4 maps from 1902 on.
Museums, parks, gardens and other places to visit around Washingtonville. Close and well known come first.
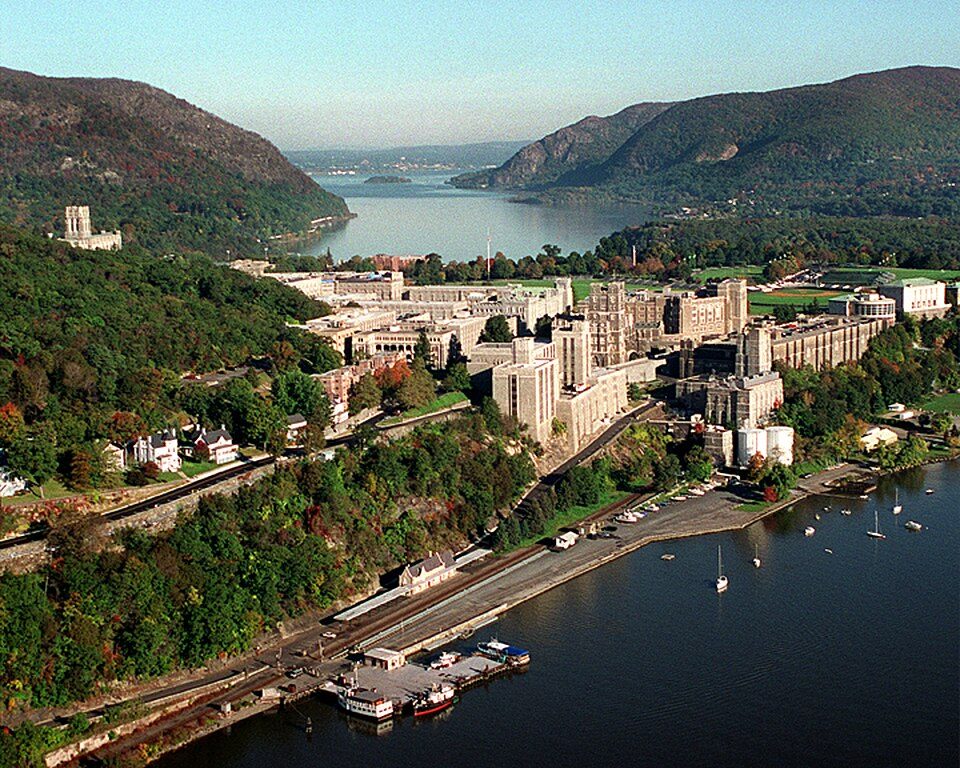
Big draw11 mi MuseumUnited States Military Academy
33 mi LandmarkFerncliff Cemetery
25 mi National Historic SiteHome of Franklin D. Roosevelt National Historic Site102K visitors a year
11 mi Stadium & arenaMichie Stadium
5 mi MuseumStorm King Art Center
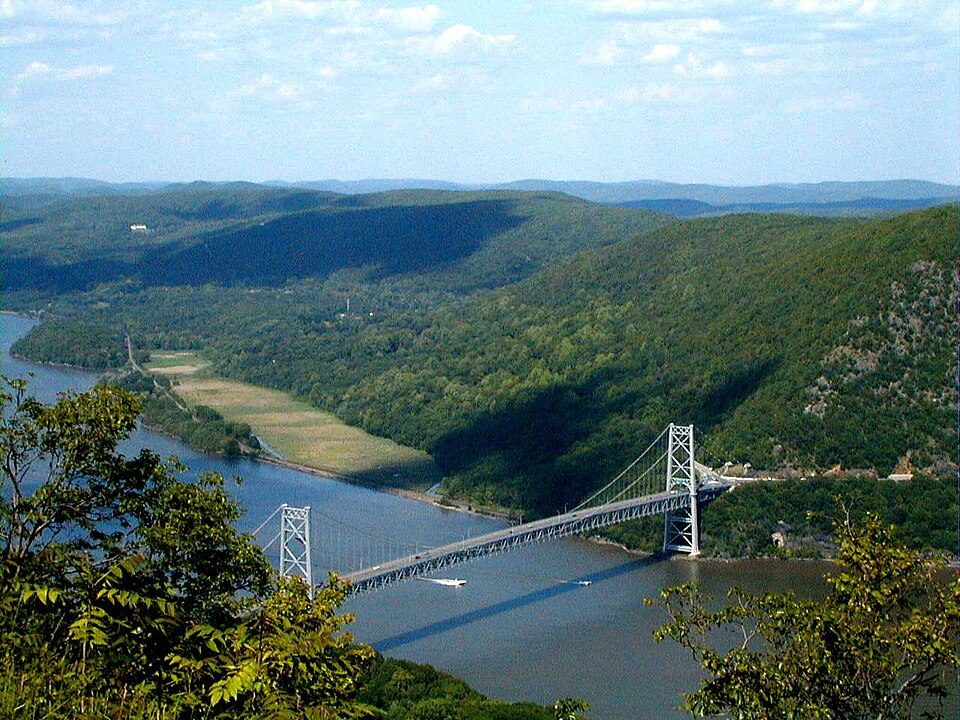
11 mi State parkBear Mountain State Park1.9M visitors a yearUnited States Military Academy: USMA Public Affairs Office, Public domain · Ferncliff Cemetery: Anthony22 at English Wikipedia, CC BY-SA 3.0 · Home of Franklin D. Roosevelt National Historic Site: Crunch, CC BY-SA 4.0 · Michie Stadium: John Pellino, Public domain · Storm King Art Center: Doug Kerr from Albany, NY, United States, CC BY-SA 2.0 · Bear Mountain State Park: Mwanner at English Wikipedia, Public domain
Who provides power, water and the rest in Washingtonville, and how to reach them.
EPA SDWIS (Oct 9, 2026) · HIFLD + EIA-861 2025 · Census 2020 ZCTAs · NCES 2024–25 · registration: vote.gov, updated Aug 3, 2026.
Ordered by what stands out in Washingtonville.
Washingtonville has less tooth loss than most of New York and is safe by national standards but not by New York’s; it also has a long record of flood insurance claims.
Its widest gap with New York is tooth loss: 8% of those 65+ have lost all their teeth, against 12.8% statewide.
17% of Washingtonville adults have been diagnosed with depression. Washingtonville beats the New York average on 10 of 32 CDC measures and trails it on 0. 9.8% of Washingtonville adults smoke cigarettes.
| Washingtonville | New York towns | U.S. towns | |
|---|---|---|---|
| Depression (CDC PLACES) | 17% | 21% | 23% |
| Smoke cigarettes (CDC PLACES) | 9.8% | 13% | 14% |
| Frequent mental distress (CDC PLACES) | 14% | 16% | 17% |
| High blood pressure (CDC PLACES) | 31% | 34% | 35% |
| What stands out | Washingtonville | NY |
|---|---|---|
| Fewer older adults who have lost all their teeth | 8% | 12.8% |
| Fewer adults facing food insecurity | 11.9% | 17.2% |
CDC PLACES 2025 · modeled estimates for adults · CMS · HRSA
At 7.4 crimes per 1,000 residents a year, it reports less crime than 69% of New York’s graded towns. Violent crime is rare: 2 reported in 2025, 0.4 per 1,000 residents.
Washingtonville’s property crime rate is 3.9 per 1,000 residents.
| Washingtonville | New York towns | U.S. towns | |
|---|---|---|---|
| Property crimes per 1,000 (2025) | 3.9 per 1,000 residents | 7.6 | 9.9 |
| Violent crimes per 1,000 (2025) | 0.4 per 1,000 residents | 0.8 | 1.6 |
FBI crime data, 2025 · crimes reported to police
Most working residents leave Washingtonville for work: only 7% work in town. The top destinations are New York (22%), Blooming Grove (9%) and Wallkill (5%).
| Washingtonville | New York towns | U.S. towns | |
|---|---|---|---|
| Median household income | $95,000 | $82,000 | $80,000 |
| Work from home | 14% | 12% | 11% |
| Working residents who work in town | 6.8% | 10% | 8% |
| Below the poverty line | 8.2% | 9.5% | 9.6% |
Census LEHD 2023 · ACS
Washingtonville has chilly, snowy winters and pleasant summers. July afternoons reach 84°, January nights drop to 18° and about 36 inches of snow falls in a winter.
NOAA U.S. Climate Normals, 1991–2020
No broad age group is more than 4 points off the New York average. 23% of residents are under 18 in Washingtonville. 34% of adults 25 and older have a bachelor’s degree or more, vs 40% across New York.
| Washingtonville | New York towns | U.S. towns | |
|---|---|---|---|
| Under 18 | 23% | 20% | 22% |
| Aged 65 or older | 17% | 20% | 18% |
| Bachelor’s degree or more, 25+ | 34% | 32% | 29% |
| Median age | 41.2 years | 43 years | 40.5 years |
49% women, 51% men
That’s an even split within the survey’s margin of ±3 points. Across New York, 51.2% of residents are women.
| Washingtonville | NY | U.S. | |
|---|---|---|---|
| Under 10 | 9.2% | 11% | 11.6% |
| 10 to 17 | 13.7% | 9.5% | 10.3% |
| 18 to 24 | 6.4% | 8.9% | 9.1% |
| 25 to 34 | 14.8% | 14.2% | 13.7% |
| 35 to 44 | 10.7% | 13% | 13.2% |
| 45 to 54 | 10% | 12.2% | 12.2% |
| 55 to 64 | 17.9% | 13.3% | 12.7% |
| 65 to 74 | 9.9% | 10.3% | 10.2% |
| 75 and older | 7.4% | 7.6% | 7% |
| No diploma | 7.8% | 12% | 10.4% |
| High school | 23.8% | 24.3% | 26% |
| Some college | 23% | 14.6% | 19.1% |
| Associate’s | 11% | 8.8% | 8.8% |
| Bachelor’s | 21.7% | 22.4% | 21.6% |
| Graduate | 12.7% | 17.9% | 14.1% |
U.S. Census Bureau · ACS 2020-2024 5-year estimates
225 flood insurance claims have been filed here, and 36 properties have flooded more than once.
Expected storm and flood damage is higher than in 55% of U.S. communities. Since 1978, 225 flood insurance claims have been paid out in Washingtonville.
FEMA flood insurance claims · FEMA National Risk Index · OpenFEMA
| Washingtonville | New York towns | U.S. towns | |
|---|---|---|---|
| Conserved land | 2.7% | 5.2% | 4.3% |
| Miles of trail per square mile | 0.4 miles per square mile | 0.4 | 0.4 |
| Biggest places to walk | Trails | Acres |
|---|---|---|
| 1. Memorial Park | — | 8 |
| 2. Mays Field | — | 6 |
| 3. L Vern Allen Park | — | 4 |
Trails & parks © OpenStreetMap contributors · Conserved land: USGS PAD-US
70.9% of renter households pay 30% or more of their income for housing, against 52.1% across New York.
The typical Washingtonville home is worth about $530,000, up 4% in a year, close to the New York typical home. The median rent in Washingtonville is $1,351 a month.
| Washingtonville | New York towns | U.S. towns | |
|---|---|---|---|
| Median rent | $1,351 a month | $1,098 a month | $1,185 a month |
| Households that own their home | 79% | 75% | 73% |
Census ACS, 2020–24 · Zillow Home Value Index · Redfin Data Center
6 within 15 miles of the center of Washingtonville
About 5 of every 100 Washingtonville residents are enrolled in college, against 7 across New York.
One town shares a border with Washingtonville.
| Town | NY rank | Overall | Cost | Safety | Schools | Health |
|---|---|---|---|---|---|---|
| Washingtonville | #161 | A− | C | A− | B | A |
| Beaver Dam Lake | — | — | — | — | — | — |
Beaver Dam Lake isn’t graded (fewer than 1,000 residents, or not enough data). Compare Washingtonville with a neighbor →
Short answers, built from the data on this page.
By most measures, yes. Washingtonville grades A− overall, better than 81% of U.S. towns and #161 of 745 in New York. It grades A for health, A− for safety and B for schools.
Cost of living, which also weighs rents, property taxes and how many households pay 30% or more of their income for housing, grades C.