Billington HeightsNY
A town of 1,610.
Is Billington Heights a good place to live?
Billington Heights’ median age is 58.2 years, above both New York’s towns (43 years) and U.S. towns (40.5 years). Among 759 New York towns, just 3 have a lower share of working residents who work in town than Billington Heights. Billington Heights’ trail density is 0.9 miles per square mile, where New York’s towns sit at 0.4 and U.S. towns at 0.4. We don’t grade Billington Heights yet; the figures below are still real.
Highmark Stadium and 46 more within 40 miles
Museums, parks, gardens and other places to visit around Billington Heights. Close and well known come first.
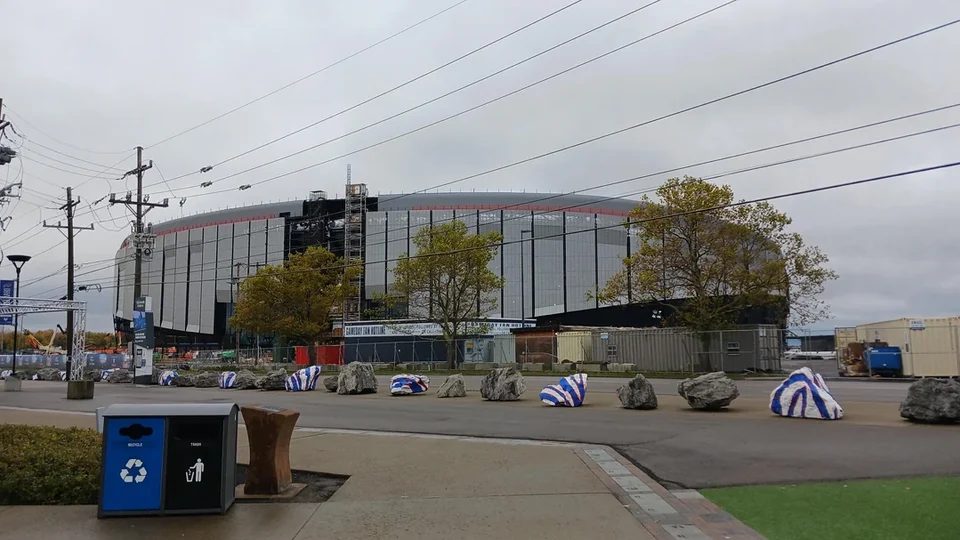 Big draw8 mi Stadium & arenaHighmark Stadium
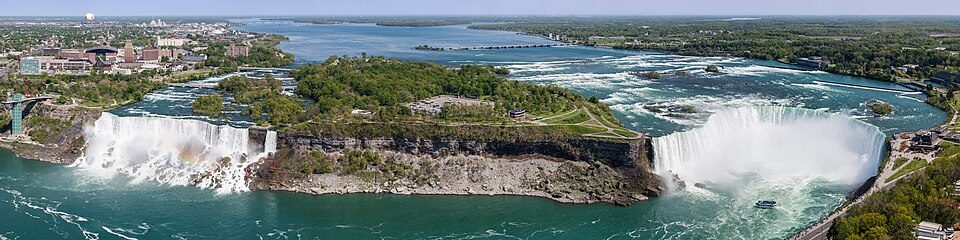 Big draw30 mi WaterfallNiagara Falls
 Big draw8 mi Stadium & arenaRalph Wilson Stadium
 9 mi WaterfallEternal Flame Falls
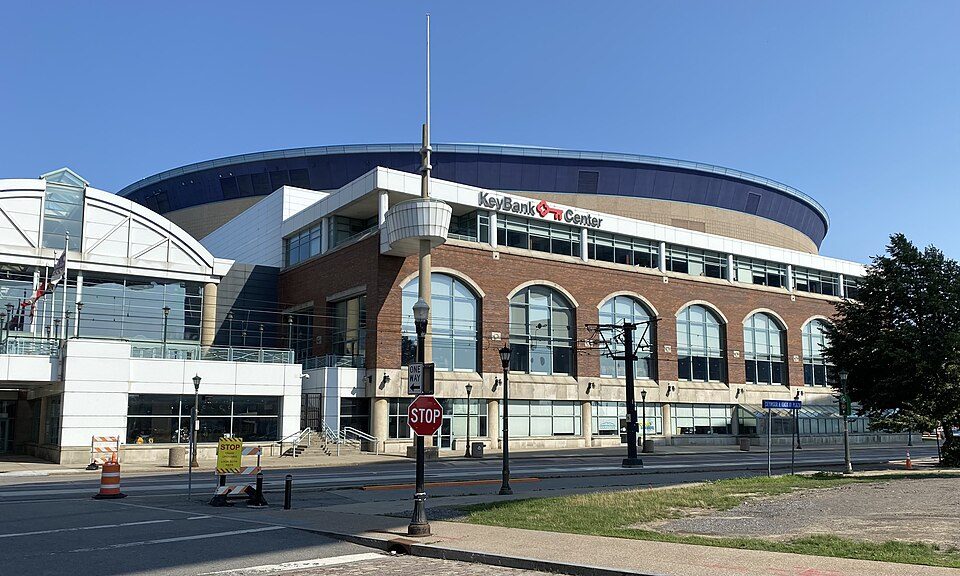 14 mi Stadium & arenaKeyBank Center
 14 mi MuseumUSS The Sullivans
Photo credits
Highmark Stadium: James161723, CC0 · Niagara Falls: Robert F. Tobler, CC BY-SA 4.0 · Ralph Wilson Stadium: User Evilarry on en.wikipedia, Public domain · Eternal Flame Falls: Mpmajewski, CC BY-SA 3.0 · KeyBank Center: Andre Carrotflower, CC BY-SA 4.0 · USS The Sullivans: Unknown, Public domain


Moving to Billington Heights: who provides what
Billington Heights is unincorporated, so Erie County and regional agencies provide most services.
EPA SDWIS (Oct 9, 2026) · HIFLD + EIA-861 2025 · Census 2020 ZCTAs · NCES 2024–25 · registration: vote.gov, updated Aug 3, 2026.
The data
Ordered by what stands out in Billington Heights.
Fewer children than New York overall
Children under 18 are 8% of residents (21% statewide); people 65 and older are 31% of residents (18% statewide). 47% of adults 25 and older hold a bachelor’s degree or more in Billington Heights.
Ages · share of residents
Education · adults 25 and older
Women and men · all residents
54% women, 46% men
That’s an even split within the survey’s margin of ±7.4 points. Across New York, 51.2% of residents are women.
| Billington Heights | NY | U.S. | |
|---|---|---|---|
| Under 10 | 2.1% | 11% | 11.6% |
| 10 to 17 | 5.5% | 9.5% | 10.3% |
| 18 to 24 | 6.3% | 8.9% | 9.1% |
| 25 to 34 | 10.7% | 14.2% | 13.7% |
| 35 to 44 | 5.6% | 13% | 13.2% |
| 45 to 54 | 4.3% | 12.2% | 12.2% |
| 55 to 64 | 34.9% | 13.3% | 12.7% |
| 65 to 74 | 23% | 10.3% | 10.2% |
| 75 and older | 7.5% | 7.6% | 7% |
| No diploma | 1.9% | 12% | 10.4% |
| High school | 22.5% | 24.3% | 26% |
| Some college | 15.4% | 14.6% | 19.1% |
| Associate’s | 13.3% | 8.8% | 8.8% |
| Bachelor’s | 35.1% | 22.4% | 21.6% |
| Graduate | 11.8% | 17.9% | 14.1% |
U.S. Census Bureau · ACS 2020-2024 5-year estimates · in a town of 1,600, single groups can be off by several points
Low risk in Billington Heights, with inland flooding at the top
Expected storm and flood damage is lower than in 70% of U.S. communities.
FEMA National Risk Index · OpenFEMA
In Billington Heights, expect snowy winters and pleasant summers
Billington Heights has chilly, snowy winters and pleasant summers. The July high in Billington Heights is 80°F.
Typical low → high °F
NOAA U.S. Climate Normals, 1991–2020
A job hub: Billington Heights has 1.5 jobs for every working resident and draws in 1,197 commuters
Most working residents leave Billington Heights for work: only 1% work in town. Billington Heights’ average trip to work is 17 minutes. Since 2013, Billington Heights has added 140 jobs, to 1,208 in 2023.
| Billington Heights | New York towns | U.S. towns | |
|---|---|---|---|
| Average trip to work | 17 minutes | 25 minutes | 25 minutes |
| Below the poverty line | 12% | 9.5% | 9.6% |
Where working residents work
Census LEHD 2023 · ACS
Billington Heights stands out in New York and nationally: a larger share of its adults had a checkup this year
84% of Billington Heights adults had a checkup this year. Billington Heights beats the New York average on 19 of 32 CDC measures and trails it on 2. 3.7% of Billington Heights adults 18 to 64 have no health insurance.
| Billington Heights | New York towns | U.S. towns | |
|---|---|---|---|
| Feel lonely (CDC PLACES) | 27% | 32% | 33% |
| Frequent mental distress (CDC PLACES) | 13% | 16% | 17% |
| Yearly checkup (CDC PLACES) | 84% | 81% | 79% |
| Smoke cigarettes (CDC PLACES) | 9.1% | 13% | 14% |
| What stands out | Billington Heights | NY |
|---|---|---|
| Fewer adults facing food insecurity | 6.7% | 17.2% |
| Fewer adults facing housing insecurity | 6.6% | 14.5% |
| More adults who have had cancer | 11.3% | 7.7% |
CDC PLACES 2025 · modeled estimates for adults · CMS · HRSA
Zillow Home Value Index · Redfin Data Center
Trails & parks © OpenStreetMap contributors · Conserved land: USGS PAD-US
Everything we know about Billington Heights
Colleges nearby
7 within 15 miles of the center of Billington Heights
About 7 of every 100 Billington Heights residents are enrolled in college, about the same as New York.
About Billington Heights
Census-designated place in New York, United States
Billington Heights is a hamlet and census-designated place (CDP) in the towns of Elma and Aurora in Erie County, New York, United States. As of the 2020 census, Billington Heights had a population of 1,748. It is part of the Buffalo–Niagara Falls Metropolitan Statistical Area.
From Wikipedia, licensed CC BY-SA 4.0 · facts via Wikidata (CC0)
- Area
- 3.2 sq mi
- Elevation
- 951 ft
Billington Heights’s neighbors
4 towns share a border with Billington Heights.
| Town | NY rank | Overall | Cost | Safety | Schools | Health |
|---|---|---|---|---|---|---|
| Billington Heights | — | — | — | — | — | — |
| East Aurora | #58 | A | C− | — | A− | A+ |
| Elma Center | — | — | — | — | — | — |
| Elma | #112 | A | C+ | — | A− | A |
| Aurora | #95 | A | C− | — | A− | A |
East Aurora, Elma and Aurora report no FBI crime data of their own. Billington Heights and Elma Center aren’t graded (fewer than 1,000 residents, or not enough data). Compare Billington Heights with a neighbor →
Questions about Billington Heights
Short answers, built from the data on this page.
Is Billington Heights, NY a good place to live?
We don’t grade Billington Heights yet; the figures below are still real.