
Craig Leib Memorial Field, Laurel Springs, NJ, Nov. 2024, 2024
Laurel Springs’s story
135 years in pictures
The archive holds 5 old photos and papers going back to 2024.
- 1891Laurel Springs is settled
Each edition grades its towns against each other only.

Laurel Springs’ best subject grades are an A+ for walkability and an A for health and incomes. On cost of living, just 33 of New Jersey’s 530 towns do better. Laurel Springs's civic life (library use, community groups, volunteering) trails 97% of U.S. towns. Only 42 of New Jersey’s 530 towns score lower on the outdoors. Laurel Springs has fewer than 2,500 residents, so it gets subject grades but no overall grade.
Where Laurel Springs beats most towns.
Where Laurel Springs’s working residents go each day. Line width shows the share.
Census LEHD 2023
Each subject compared with towns across the country (schools within New Jersey), ordered by how far Laurel Springs is from typical.
How TownRatings grades towns →
The archive holds 5 old photos and papers going back to 2024.
Museums, parks, gardens and other places to visit around Laurel Springs. Close and well known come first.
 Big draw11 mi MuseumUSS New Jersey
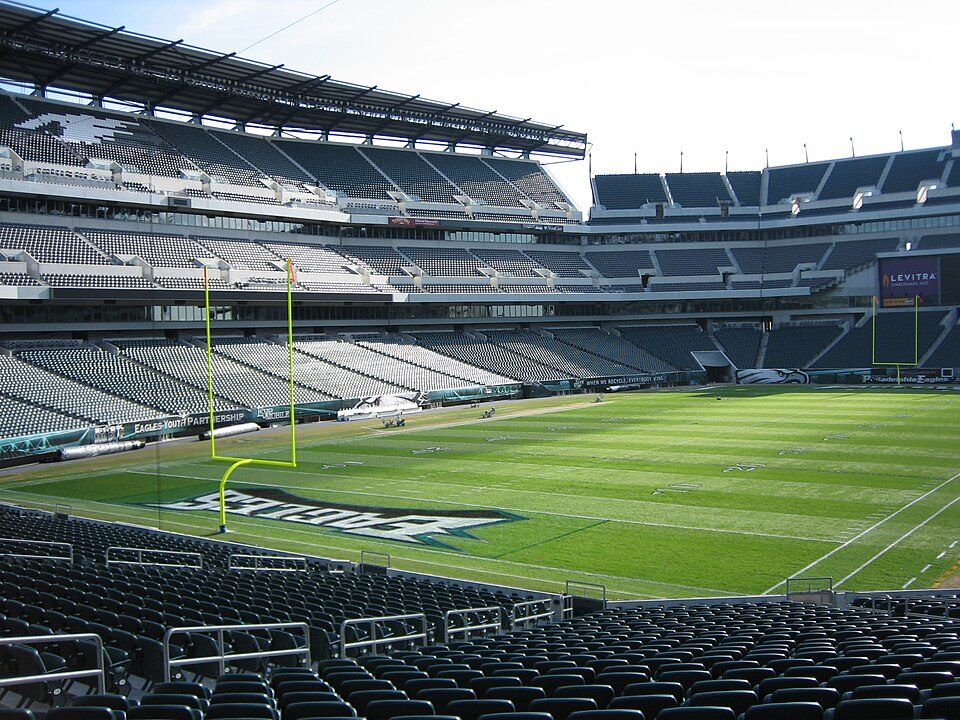 Big draw10 mi Stadium & arenaLincoln Financial Field
 Big draw10 mi Stadium & arenaXfinity Mobile Arena
 Big draw14 mi Park & preservePine Barrens
 Big draw12 mi Ancient siteIndependence Hall3.0M visitors a year
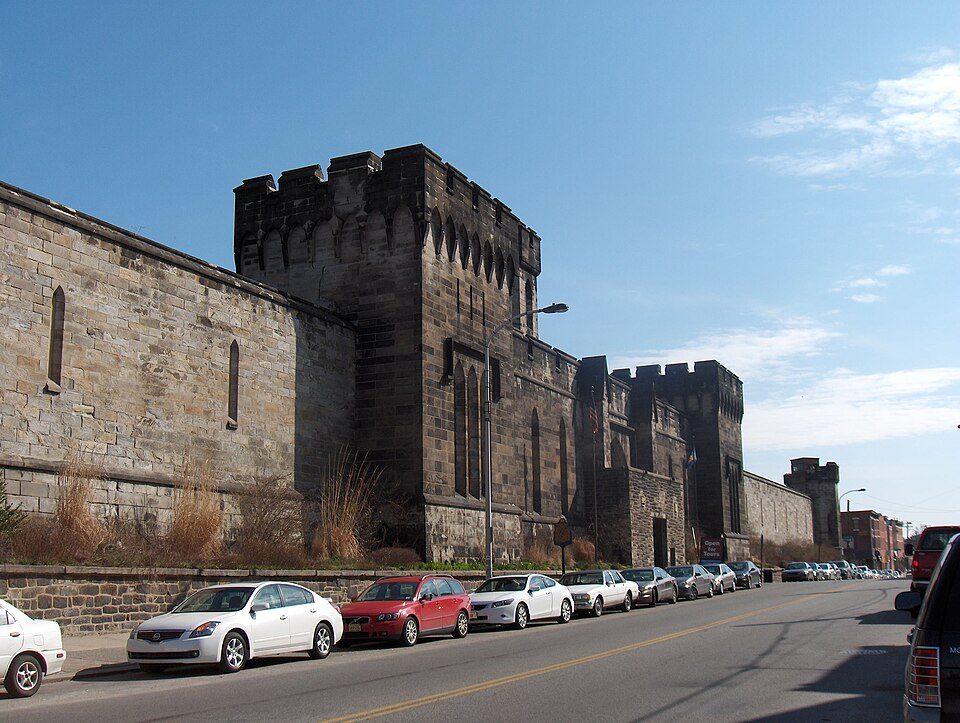 Big draw14 mi MuseumEastern State Penitentiary
USS New Jersey: Camera Operator: PH3 BRYANT, Public domain · Lincoln Financial Field: The original uploader was Betp at French Wikipedia., CC BY-SA 3.0 · Xfinity Mobile Arena: Jen Smith, CC BY 3.0 · Pine Barrens: Famartin, CC BY-SA 4.0 · Independence Hall: Mys 721tx, CC BY-SA 3.0 · Eastern State Penitentiary: Davidt8, Public domain
Who provides power, water and the rest in Laurel Springs, and how to reach them.
EPA SDWIS (Oct 9, 2026) · HIFLD + EIA-861 2025 · Census 2020 ZCTAs · NCES 2024–25 · registration: vote.gov, updated Nov 18, 2024.
Ordered by what stands out in Laurel Springs.
Laurel Springs beats the New Jersey average on 12 of 32 CDC measures and trails it on 2. 20% of Laurel Springs adults binge drink, above both New Jersey’s towns (16%) and U.S. towns (16%). 27% of adults have obesity in Laurel Springs.
| Laurel Springs | New Jersey towns | U.S. towns | |
|---|---|---|---|
| Binge drink (CDC PLACES) | 20% | 16% | 16% |
| Obesity (CDC PLACES) | 27% | 28% | 35% |
| Depression (CDC PLACES) | 19% | 16% | 23% |
| High blood pressure (CDC PLACES) | 29% | 32% | 35% |
| What stands out | Laurel Springs | NJ |
|---|---|---|
| Fewer uninsured adults | 7.7% | 11.3% |
| Fewer adults facing food insecurity | 10.1% | 14.3% |
| More binge drinkers | 19.6% | 15.5% |
CDC PLACES 2025 · modeled estimates for adults · CMS · HRSA
Its public schools are run by the Laurel Springs School District. Its one school is below.
| School | Level | Students | Letter |
|---|---|---|---|
| Laurel Springs SchoolLargest public elementary schoolGrades PK–6 | Grades PK–6 | 179 | B− |
NCES · EDFacts · graded within NJ on state tests
The typical Laurel Springs home is worth about $345,000, up 5% in a year, 40% below the New Jersey typical home. At $1,181 a month, Laurel Springs’ median rent is below the New Jersey town median ($1,778 a month) and near the median of U.S. towns ($1,185 a month).
| Laurel Springs | New Jersey towns | U.S. towns | |
|---|---|---|---|
| Median rent | $1,181 a month | $1,778 a month | $1,185 a month |
| Households that own their home | 80% | 77% | 73% |
Census ACS, 2020–24 · Zillow Home Value Index · Redfin Data Center
Most working residents leave Laurel Springs for work: only 2% work in town. Jobs based in Laurel Springs fell to 120 in 2023, 68 fewer than in 2013. The median household income in Laurel Springs is $119,000.
| Laurel Springs | New Jersey towns | U.S. towns | |
|---|---|---|---|
| Median household income | $119,000 | $113,000 | $80,000 |
| Below the poverty line | 4.3% | 6.1% | 9.6% |
| Working residents who work in town | 1.7% | 6.3% | 8% |
| Average trip to work | 29 minutes | 30 minutes | 25 minutes |
Census LEHD 2023 · ACS
Expected storm and flood damage is lower than in 68% of U.S. communities. One flood insurance claim has been paid in Laurel Springs since 2011.
FEMA flood insurance claims · FEMA National Risk Index · OpenFEMA
Laurel Springs has chilly winters and warm summers. July afternoons reach 87°, January nights drop to 26° and about 22 inches of snow falls in a winter.
NOAA U.S. Climate Normals, 1991–2020
Laurel Springs's reported crime rate is below New Jersey's. Laurel Springs’ violent crime rate is 0 per 1,000 residents. Most reported incidents are property crimes, mainly thefts.
| Laurel Springs | New Jersey towns | U.S. towns | |
|---|---|---|---|
| Violent crimes per 1,000 (2023) | 0 per 1,000 residents | 0.7 | 1.8 |
| Property crimes per 1,000 (2023) | 9.1 per 1,000 residents | 10.4 | 13.1 |
FBI crime data, 2023 · crimes reported to police
People 65 and older are 13% of residents (17% statewide); children under 18 are 26% of residents (22% statewide). 40% of Laurel Springs adults 25 and older hold a bachelor’s degree or more.
| Laurel Springs | New Jersey towns | U.S. towns | |
|---|---|---|---|
| Under 18 | 26% | 21% | 22% |
| Aged 65 or older | 13% | 18% | 18% |
| Median age | 36.9 years | 42 years | 40.5 years |
| Bachelor’s degree or more, 25+ | 40% | 45% | 29% |
50% women, 50% men
That’s an even split within the survey’s margin of ±8 points. Across New Jersey, 50.8% of residents are women.
| Laurel Springs | NJ | U.S. | |
|---|---|---|---|
| Under 10 | 12.8% | 11.6% | 11.6% |
| 10 to 17 | 13% | 10.2% | 10.3% |
| 18 to 24 | 8.5% | 8.4% | 9.1% |
| 25 to 34 | 13% | 12.9% | 13.7% |
| 35 to 44 | 13.4% | 13.3% | 13.2% |
| 45 to 54 | 13.4% | 12.9% | 12.2% |
| 55 to 64 | 13.6% | 13.5% | 12.7% |
| 65 to 74 | 8.1% | 10% | 10.2% |
| 75 and older | 4.4% | 7.2% | 7% |
| No diploma | 5.2% | 9.3% | 10.4% |
| High school | 26.8% | 25.3% | 26% |
| Some college | 19.5% | 15% | 19.1% |
| Associate’s | 8.9% | 6.7% | 8.8% |
| Bachelor’s | 28.8% | 26.1% | 21.6% |
| Graduate | 10.7% | 17.6% | 14.1% |
U.S. Census Bureau · ACS 2020-2024 5-year estimates · in a town of 2,000, single groups can be off by several points
| Biggest places to walk | Trails | Acres |
|---|---|---|
| 1. Craig Leib Memorial Field | — | 4 |
Trails & parks © OpenStreetMap contributors · Conserved land: USGS PAD-US
15 within 15 miles of the center of Laurel Springs
About 5 of every 100 Laurel Springs residents are enrolled in college, about the same as New Jersey.
Borough in Camden County, New Jersey, US
Laurel Springs is a borough in Camden County, in the U.S. state of New Jersey. As of the 2020 United States census, the borough's population was 1,978, an increase of 70 (+3.7%) from the 2010 census count of 1,908, which in turn reflected a decline of 62 (−3.1%) from the 1,970 counted in the 2000 census. Laurel Springs was incorporated as a borough by an act of the New Jersey Legislature on April 2, 1913, from portions of Clementon Township, based on the results of a referendum held on May 1, 1913. The borough was named for its therapeutic springs situated in laurel groves. In 2021, the borough had the 11th-highest property tax rate in New Jersey, with an equalized rate of 4.803% in 2020, c…
From Wikipedia, licensed CC BY-SA 4.0 · facts via Wikidata (CC0)
2 towns share a border with Laurel Springs.
| Town | NJ rank | Overall | Cost | Safety | Schools | Health |
|---|---|---|---|---|---|---|
| Laurel Springs | — | — | C+ | — | B+ | A |
| Lindenwold | #439 | D− | C | C− | D− | C− |
| Stratford | #209 | B+ | C | B+ | C+ | B+ |
Laurel Springs has fewer than 2,500 residents, so it gets subject grades but no overall grade. Laurel Springs reports no FBI crime data of its own. Compare Laurel Springs with a neighbor →
Short answers, built from the data on this page.
That is 3.8 years of the area's median household income ($91,289 across the Philadelphia-Camden-Wilmington, PA-NJ-DE-MD metro area). Cost of living, which also weighs rents, property taxes and how many households pay 30% or more of their income for housing, grades C+.


