
Jap. fishing, 1908
Belmar’s story
137 years in pictures
Census counts: 902 in 1900, 5,907 in 2020. The archive holds 6 old photos and papers going back to 1908 and 8 maps from 1888 on.
- 1889Belmar is settled
Each edition grades its towns against each other only.

Belmar's standout: it is easier to get around on foot or by transit than 98% of U.S. towns. Overall it grades B−, 303rd among New Jersey's 466 graded towns. Residents are healthier than 91% of U.S. towns on CDC estimates and 7% of its land is conserved. Its weakest subject is cost of living: the typical home is worth about $1.0 million, 10.3 years of the New York metro’s $99K median household income. Belmar’s trail density is 1.3 miles per square mile, where New Jersey’s towns sit at 0.7 and U.S. towns at 0.4. The biggest park or preserve is Maclearie Park, at 20 acres.
Where Belmar beats most towns.
Each subject compared with towns across the country (schools within New Jersey), ordered by how far Belmar is from typical.
Its grades run from A+ for walkability (better than 98% of comparable towns) to D− for cost of living (better than 2%), so the B− overall blends very different results.
How TownRatings grades towns →
Census counts: 902 in 1900, 5,907 in 2020. The archive holds 6 old photos and papers going back to 1908 and 8 maps from 1888 on.
Museums, parks, gardens and other places to visit around Belmar. Close and well known come first.
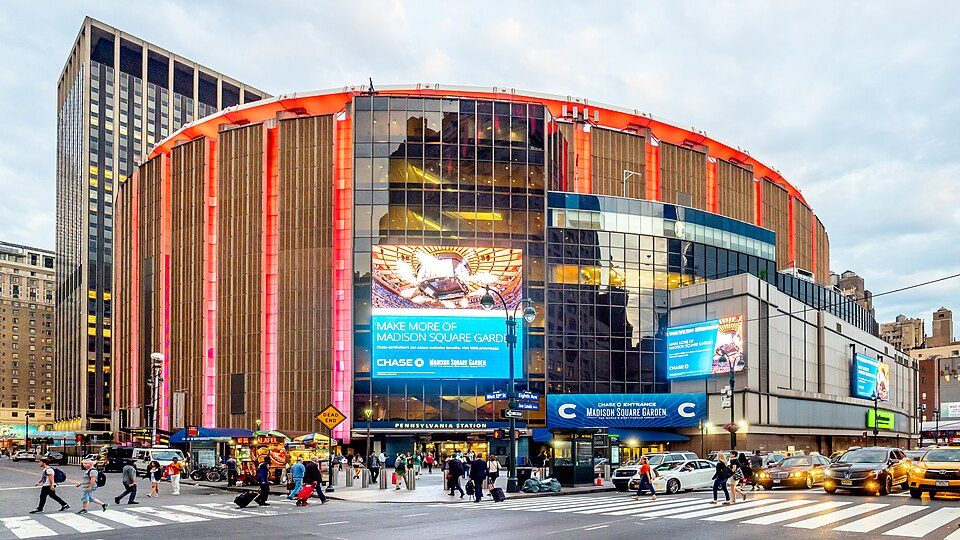 Big draw40 mi Stadium & arenaMadison Square Garden
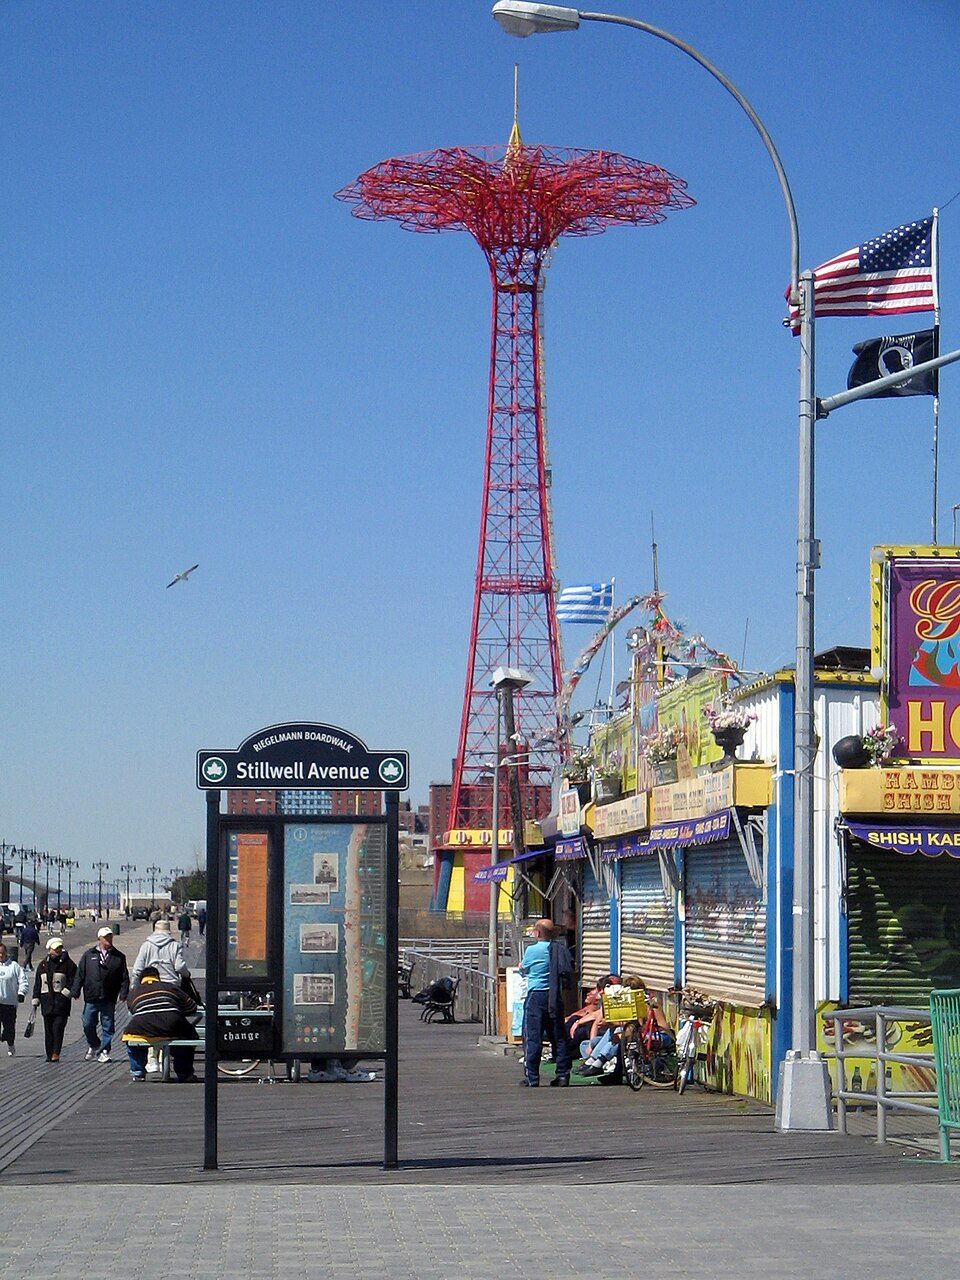 Big draw27 mi BeachConey Island
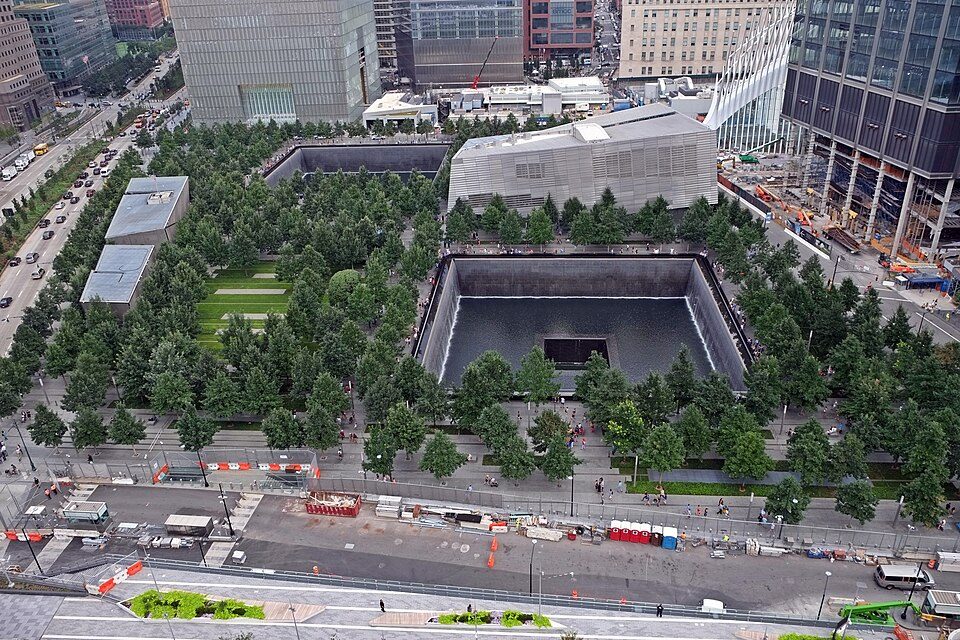 Big draw37 mi MuseumNational September 11 Memorial & Museum
 Big draw35 mi Stadium & arenaBarclays Center
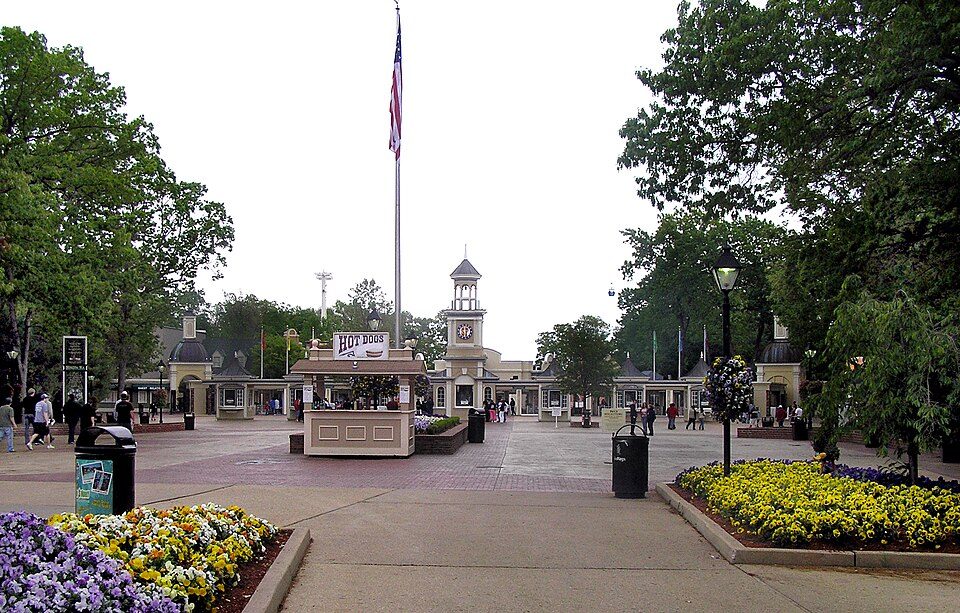 Big draw22 mi Theme parkSix Flags Great Adventure2.2M visitors a year
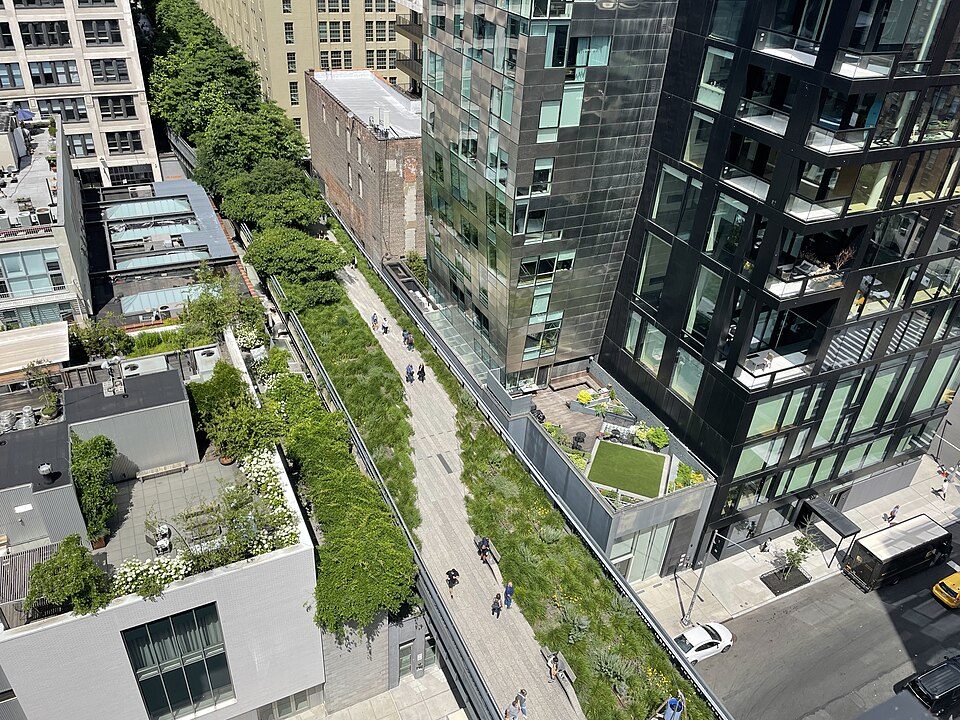 Big draw39 mi GardenHigh Line5.0M visitors a year
Madison Square Garden: Ajay Suresh from New York, NY, USA, CC BY 2.0 · Coney Island: OptimumPx, Public domain · National September 11 Memorial & Museum: Paul Sableman, CC BY 2.0 · Barclays Center: Ajay Suresh from New York, NY, USA, CC BY 2.0 · Six Flags Great Adventure: Unknown, CC BY-SA 2.5 · High Line: Wil Fyfordy, CC BY-SA 4.0
Who provides power, water and the rest in Belmar, and how to reach them.
EPA SDWIS (Oct 9, 2026) · HIFLD + EIA-861 2025 · Census 2020 ZCTAs · NCES 2024–25 · registration: vote.gov, updated Nov 18, 2024.
Ordered by what stands out in Belmar.
Belmar is a second-home town and is safe by national standards but not by New Jersey’s; it also has homes that cost more against local pay than most of New Jersey.
At 10.3 years of the New York metro’s $99K median household income, the typical home (about $1.02M) costs more against local pay than in 89% of New Jersey towns; that ratio is one input to its D− for cost of living.
57% of households own their home in Belmar, below both New Jersey’s towns (77%) and U.S. towns (73%). Typical home values rose 8.5% in the year to September 2026. The median rent in Belmar is $1,744 a month.
| Belmar | New Jersey towns | U.S. towns | |
|---|---|---|---|
| Households that own their home | 57% | 77% | 73% |
| Median rent | $1,744 a month | $1,780 a month | $1,185 a month |
Census ACS, 2020–24 · Zillow Home Value Index · Redfin Data Center
Its public schools are run by the Belmar Elementary School District. Two of its 4 schools are below, each with why it’s listed.
| School | Level | Students | Letter |
|---|---|---|---|
| Belmar ElementaryLargest public elementary schoolGrades PK–8 | Grades PK–8 | 400 | B− |
| St. Rose High School PrivateLargest high schoolGrades 9–12 | Grades 9–12 | 394 | – |
NCES · EDFacts · graded within NJ on state tests
| Biggest places to walk | Trails | Acres |
|---|---|---|
| 1. Maclearie Park | 0.8 mi | 20 |
| 2. Three Acre Park | — | 3 |
| 3. Dempsey Park | — | 3 |
Trails & parks © OpenStreetMap contributors · Conserved land: USGS PAD-US
Within New Jersey it is healthier than 60% of the 468 graded towns: New Jersey sets a high bar. Its widest gap with New Jersey is food insecurity: 9.2% of its 5,105 adults worry about having enough food, against 14.3% statewide.
28% of Belmar adults feel lonely. Belmar beats the New Jersey average on 13 of 32 CDC measures and trails it on 1. 15% of Belmar adults have been diagnosed with depression.
| Belmar | New Jersey towns | U.S. towns | |
|---|---|---|---|
| Feel lonely (CDC PLACES) | 28% | 32% | 33% |
| Depression (CDC PLACES) | 15% | 16% | 23% |
| Sleep under 7 hours (CDC PLACES) | 32% | 36% | 36% |
| Get no exercise (CDC PLACES) | 19% | 22% | 25% |
| What stands out | Belmar | NJ |
|---|---|---|
| Fewer adults facing food insecurity | 9.2% | 14.3% |
| Fewer adults facing housing insecurity | 8.5% | 12.3% |
| More adults who have had cancer | 8.9% | 7.5% |
CDC PLACES 2025 · modeled estimates for adults · CMS · HRSA
17.1% of homes are seasonal or vacation homes, against 3.4% statewide, which helps explain the older median age.
Children under 18 are 12% of residents (22% statewide); adults 35 to 64 are 46% of residents (40% statewide). 54% of adults 25 and older hold a bachelor’s degree or more in Belmar.
| Belmar | New Jersey towns | U.S. towns | |
|---|---|---|---|
| Under 18 | 12% | 21% | 22% |
| Median age | 49.5 years | 42 years | 40.5 years |
| Bachelor’s degree or more, 25+ | 54% | 45% | 29% |
| Aged 65 or older | 20% | 18% | 18% |
41% women, 59% men
About 143 men for every 100 women (the survey’s margin: ±4.7 points). Across New Jersey, 50.8% of residents are women. Among residents 18 to 24, 82% are men (NJ 51%).
| Belmar | NJ | U.S. | |
|---|---|---|---|
| Under 10 | 6.8% | 11.6% | 11.6% |
| 10 to 17 | 5.2% | 10.2% | 10.3% |
| 18 to 24 | 5.1% | 8.4% | 9.1% |
| 25 to 34 | 16.9% | 12.9% | 13.7% |
| 35 to 44 | 12.1% | 13.3% | 13.2% |
| 45 to 54 | 12.8% | 12.9% | 12.2% |
| 55 to 64 | 20.9% | 13.5% | 12.7% |
| 65 to 74 | 14.9% | 10% | 10.2% |
| 75 and older | 5.4% | 7.2% | 7% |
| No diploma | 7.9% | 9.3% | 10.4% |
| High school | 11.3% | 25.3% | 26% |
| Some college | 19% | 15% | 19.1% |
| Associate’s | 8.3% | 6.7% | 8.8% |
| Bachelor’s | 40.3% | 26.1% | 21.6% |
| Graduate | 13.3% | 17.6% | 14.1% |
U.S. Census Bureau · ACS 2020-2024 5-year estimates
Belmar has chilly winters and warm summers, with plenty of rain. July afternoons reach 85° and January nights drop to 26°.
NOAA U.S. Climate Normals, 1991–2020
Belmar has about as many jobs (2,455) as working residents, but only 164 people both live and work here. Jobs based here grew from 1,026 in 2013 to 2,455.
Most working residents leave Belmar for work: only 6% work in town. Jobs based in Belmar grew to 2,455 in 2023, 1,429 more than in 2013. Belmar’s average trip to work is 32 minutes.
| Belmar | New Jersey towns | U.S. towns | |
|---|---|---|---|
| Average trip to work | 32 minutes | 30 minutes | 25 minutes |
| Median household income | $94,000 | $113,000 | $80,000 |
| Work from home | 17% | 16% | 11% |
| Below the poverty line | 7.7% | 6% | 9.6% |
Census LEHD 2023 · ACS
431 flood insurance claims have been filed here, and 35 properties have flooded more than once.
Expected storm and flood damage is lower than in 57% of U.S. communities. Since 1978, 431 flood insurance claims have been paid out in Belmar.
FEMA flood insurance claims · FEMA National Risk Index · OpenFEMA
At 20.8 crimes per 1,000 residents a year, it reports more crime than 74% of New Jersey’s graded towns.
FBI crime data, 2025 · crimes reported to police
23 within 15 miles of the center of Belmar
About 5 of every 100 Belmar residents are enrolled in college, about the same as New Jersey.
7 notable people were born in Belmar.




Borough in Monmouth County, New Jersey, US
Belmar is a borough located on the Jersey Shore in Monmouth County, in the U.S. state of New Jersey. As of the 2020 United States census, the borough's population was 5,907, an increase of 113 (+2.0%) from the 2010 census count of 5,794, which in turn reflected a decline of 251 (−4.2%) from the 6,045 counted in the 2000 census. What is now Belmar was originally incorporated as Ocean Beach borough by an act of the New Jersey Legislature on April 9, 1885, from portions of Wall Township, based on the results of a referendum held two days earlier. On April 16, 1889, it became the City of Elcho borough, which lasted for a few weeks until the name was changed to the City of Belmar Borough on May …
From Wikipedia, licensed CC BY-SA 4.0 · facts via Wikidata (CC0)
7 towns share a border with Belmar.
| Town | NJ rank | Overall | Cost | Safety | Schools | Health |
|---|---|---|---|---|---|---|
| Belmar | #303 | B− | D− | B− | B− | A |
| Neptune Township | #428 | D | D− | D | D− | B+ |
| Avon-by-the-Sea | — | — | D− | B | A | A+ |
| Shark River Hills | — | — | — | — | — | — |
| Wall Township | #198 | B+ | D | B | B | A |
| West Belmar | — | — | — | — | — | — |
| Lake Como | — | — | D− | — | — | A− |
| Spring Lake | #61 | A | D− | B | A+ | A+ |
Avon-by-the-Sea and Lake Como have fewer than 2,500 residents, so they get subject grades but no overall grade. Lake Como reports no FBI crime data of its own. Shark River Hills and West Belmar aren’t graded (fewer than 1,000 residents, or not enough data). Compare Belmar with a neighbor →
Short answers, built from the data on this page.
Belmar grades B− overall, better than 48% of U.S. towns and #303 of 466 in New Jersey. It grades A for health, B− for safety and B− for schools. Cost of living is its weak spot, with a D−.
Yes. Cost of living, which also weighs rents, property taxes and how many households pay 30% or more of their income for housing, grades D−.
7 notable people were born here, including Tom McGowan and Marina Mabrey.


