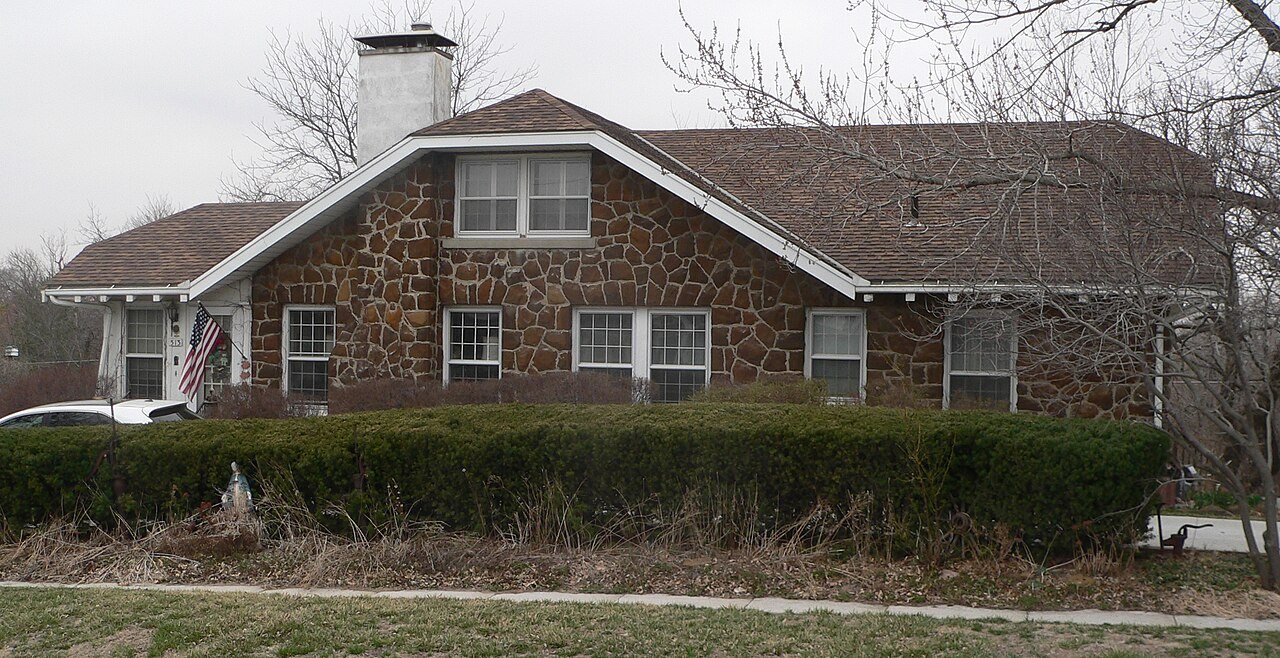
 Paul Fitzgerald House · Photo: Ammodramus · CC0
Louisville’s library logs 5.7 visits per resident, against a typical 3.5 for libraries its size
Louisville Public Library serves Louisville’s 1,408 residents. Last year it lent 14K books, movies and e-books and logged 7,990 visits.
The short version on Louisville’s library
Busy on a lean budget
Louisville Public Library spends $36 per resident, less than 74% of similar-size libraries (typical: $54). It’s still busier than 72% of them. What your card is worth ↓
A small-town library
Louisville Public Library serves 1,408 residents with about one full-time staff, open about 34 hours a week. It’s compared only with libraries serving under 2,500 people, because per-person numbers always look big in a small town. A year at the library ↓
More than half the print loans are for kids
Children’s books and media are 70% of print loans, and kids’ borrowing per resident is higher than at 85% of similar-size libraries. That works out to about 18 items per child in Louisville last year. Kids & programs ↓
Big on e-books and audiobooks
Digital borrowing runs 3.6 e-items per resident, against a typical 1, higher than at 91% of similar-size libraries. It’s 36% of all loans. What people borrow ↓
This summary is written from the numbers on this page. Numbers are the library’s own report to the Public Libraries Survey, fiscal year 2024; in a town this small, one busy program or a few avid readers move the per-resident numbers.
What’s behind Louisville’s civic life grade
On library visits, community nonprofits and volunteering, Louisville is ahead of 96% of U.S. towns. All three inputs are above most U.S. towns; the share of younger adults in volunteering groups ranks highest.
Civic life counts registered nonprofits, library visits and online volunteering groups, so it can miss civic life that runs through congregations, mutual aid or neighbors looking out for each other.
Library visits: IMLS Public Libraries Survey, FY2024. Nonprofits: IRS Exempt Organizations Business Master File, October 2026. Volunteering: Social Capital Atlas (Opportunity Insights), from data by Meta Platforms, Inc.; Chetty et al., Nature 2022. How TownRatings grades civic life →
12 community nonprofits are registered in Louisville
8.3 per 1,000 residents, against a U.S. town median of 3.7. The largest group: youth, sports & recreation.
Community nonprofits, by kind
Counted from the IRS list of tax-exempt organizations by mailing address (fractions where a ZIP code spans towns). Congregations are counted apart (3 here), since whether a church registers depends on its denomination, not the town. 1 more name a national or statewide reach and are left out.
14.8%
14.8% of Louisville’s Facebook users aged 25–44 belong to a volunteering or activism group, against 7.9% in the typical Nebraska town and 7.5% nationally.
Volunteering: Social Capital Atlas (Opportunity Insights), from data by Meta Platforms, Inc.; Chetty et al., Nature 2022. ZIP-code figures, weighted by where Louisville’s residents live; 2022.
More than half the print loans are kids’ books
14K loans last year: print, kids’ and digital.
Each of the 17K books and other items on the shelves went out about 0.5 time last year, on average.
5,058 e-books, e-audiobooks and streams last year. Borrow from home with your card, plus research databases: courses, journals, genealogy and more.
Ahead of most similar-size libraries on 5 of 8 measures
Per resident, against libraries serving under 2,500 people across the U.S.
Louisville Public Library serves 1,408 people, so it’s measured against U.S. libraries serving under 2,500.
Every hour the doors are open, about 8 items go out
Fiscal year 2024. The library’s own count.
24 programs a year
Story times, clubs, classes and events, by who they’re for.
Programs last year by age group
story times and programs a week for ages 0–5, on average.
children’s books and media borrowed per child under 18 in Louisville last year.
Find it
Louisville Public Library, 217 Main Street, Louisville.


No late fees. E-books and audiobooks from home. Research databases: courses, journals, genealogy.
New in Louisville? The Handbook →Hours are the survey’s yearly average. Check the library’s own site for today’s hours.
For every $1 it spends, the library lends about $4.11 worth
Set what you’d borrow in a month. It starts at what the average Louisville cardholder borrows.
Typical for a library this size: $54. Operating budget $50K.
Last year the library lent and hosted about $206K worth of books, e-books, programs and Wi-Fi on a $50K budget.
Fine-free. No late fees on books returned late.
Retail prices are typical, rounded down: a new book $17, a kids’ book $12, an e-book or e-audiobook $15, a movie rental $4, a class or program $10, a computer or Wi-Fi session $3. The average cardholder’s month = the library’s yearly loans, attendance and Wi-Fi sessions ÷ its 481 cardholders ÷ 12.
What this data can and can’t tell you
From the Public Libraries Survey, fiscal year 2024.
- The library’s own count. Libraries report their own visits, loans and programs. A library that didn’t respond keeps its address and hours here, with no numbers.
Hours are the survey’s yearly average; libraries are compared with others serving about as many people. How TownRatings uses library figures →
Questions about the library and civic life in Louisville
Does Louisville have a public library?
Yes. Louisville Public Library, 217 Main Street, serves Louisville’s 1,408 residents (the survey’s count) and is open about 34 hours a week, averaged over the year.
Is Louisville Public Library fine-free? Does it lend e-books?
Yes to both: no late fees, and e-books, audiobooks and research databases with a card (the library’s 2024 survey report).
How busy is Louisville’s library?
It logged 5.7 visits and lent 9.9 items per resident in 2024, against a typical 3.5 visits for libraries serving under 2,500 people.
What is Louisville’s civic life grade?
A+ Louisville is ahead of 96% of U.S. towns on civic life. The grade combines library visits per resident, community nonprofits per 1,000 residents and the share of adults 25–44 in volunteering groups. It’s a character grade, so it isn’t part of the overall grade. How it works.
Book talk
Reading, story times and the library in Louisville.
Libraries: Institute of Museum and Library Services, Public Libraries Survey, fiscal year 2024. Each library reports its own numbers. Distances are straight-line from the town center. “What your card is worth” uses typical retail prices and is an estimate, not an official figure.