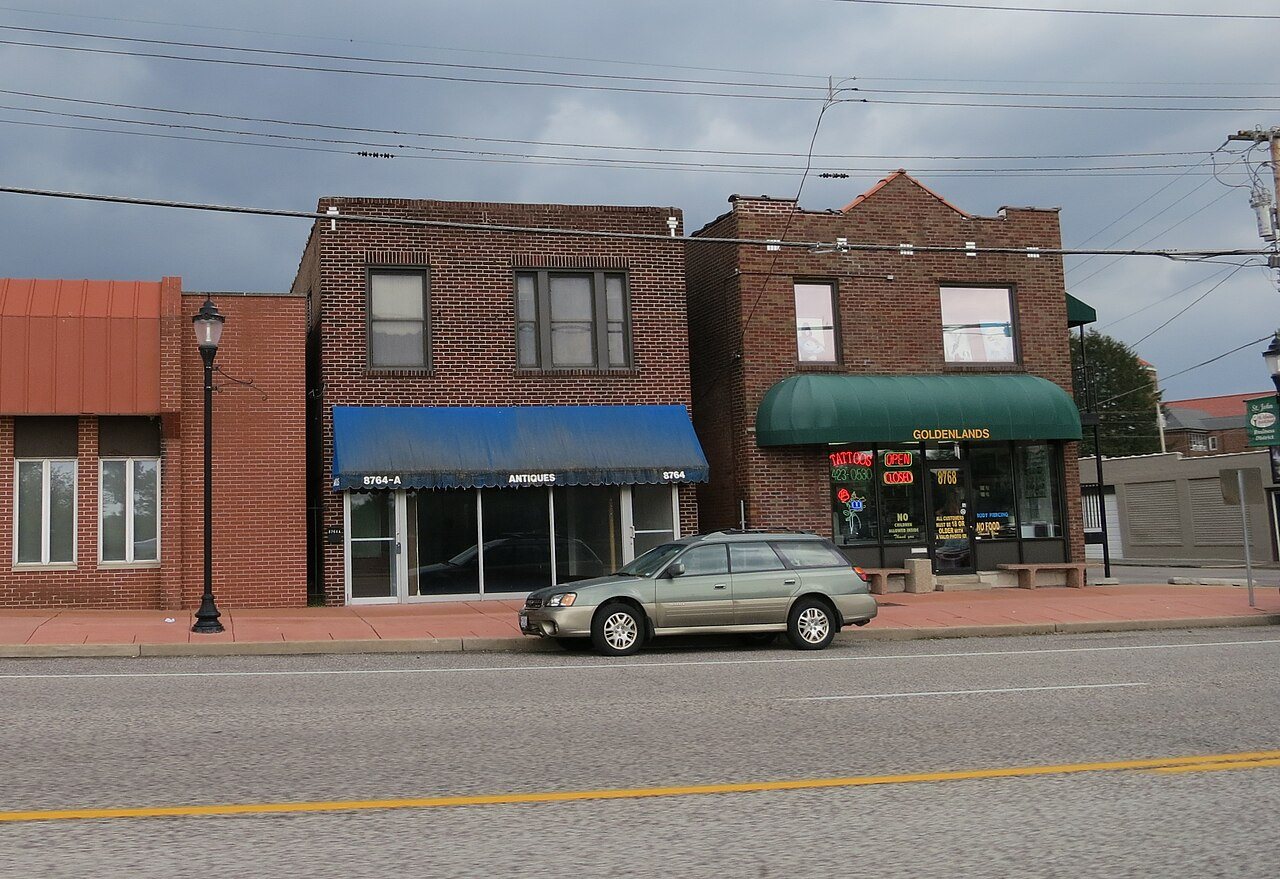
Downtown, 2013
St. John’s story
St. John in pictures
Census counts: 149 in 1880, a peak of 8,960 in 1970, 6,643 in 2020. The archive holds 1 old photo or paper going back to 2013 and 6 maps from 1933 on.
Explore the history →Each edition grades its towns against each other only.

A town of 6,441.
St. John earns a D−, 243rd of 247 graded towns in Missouri, mostly because of health and schools. Its schools rank behind 93% of the state's. What it does well: it is easier to get around on foot or by transit than 68% of U.S. towns. St. John’s violent crime rate is 7.8 per 1,000 residents, where Missouri’s towns sit at 2.2 and U.S. towns at 1.6. Only 37 of Missouri’s 390 towns score lower on civic life. St. John's police reported 50 violent crimes reported to the FBI in 2025, a higher rate per resident than 89% of U.S. towns.
Where St. John’s working residents go each day. Line width shows the share.
Census LEHD 2023
Each subject compared with towns across the country (schools within Missouri), ordered by how far St. John is from typical.
How TownRatings grades towns →
Census counts: 149 in 1880, a peak of 8,960 in 1970, 6,643 in 2020. The archive holds 1 old photo or paper going back to 2013 and 6 maps from 1933 on.
Explore the history →Museums, parks, gardens and other places to visit around St. John. Close and well known come first.
 Big draw16 mi State parkCahokia
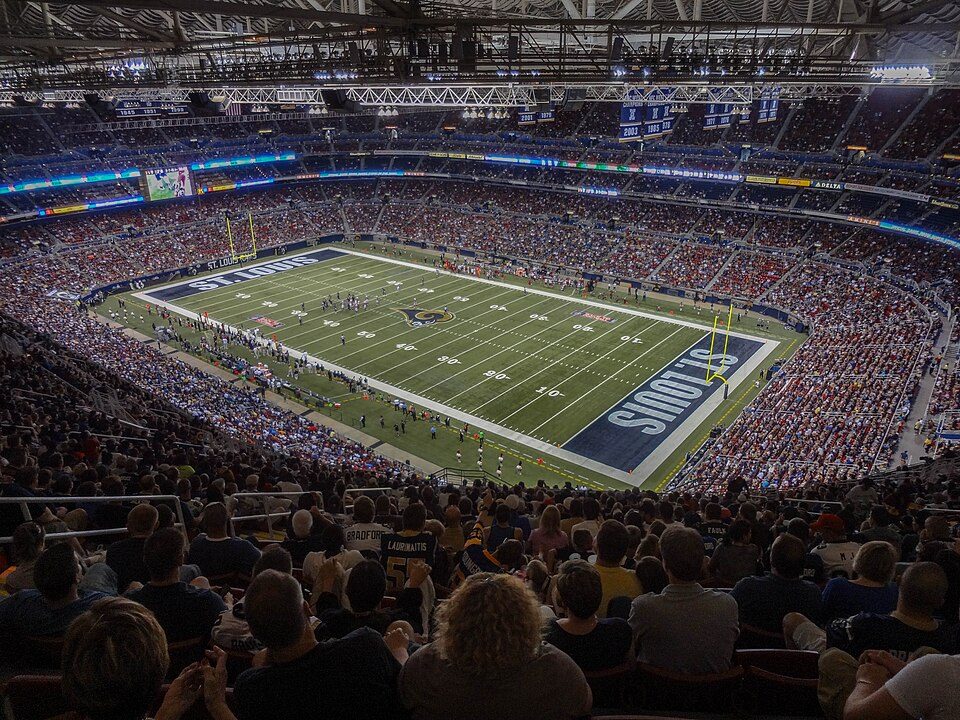 Big draw10 mi Stadium & arenaThe Dome at America's Center
 10 mi Stadium & arenaBusch Stadium
 10 mi National ParkGateway Arch National Park2.2M visitors a year
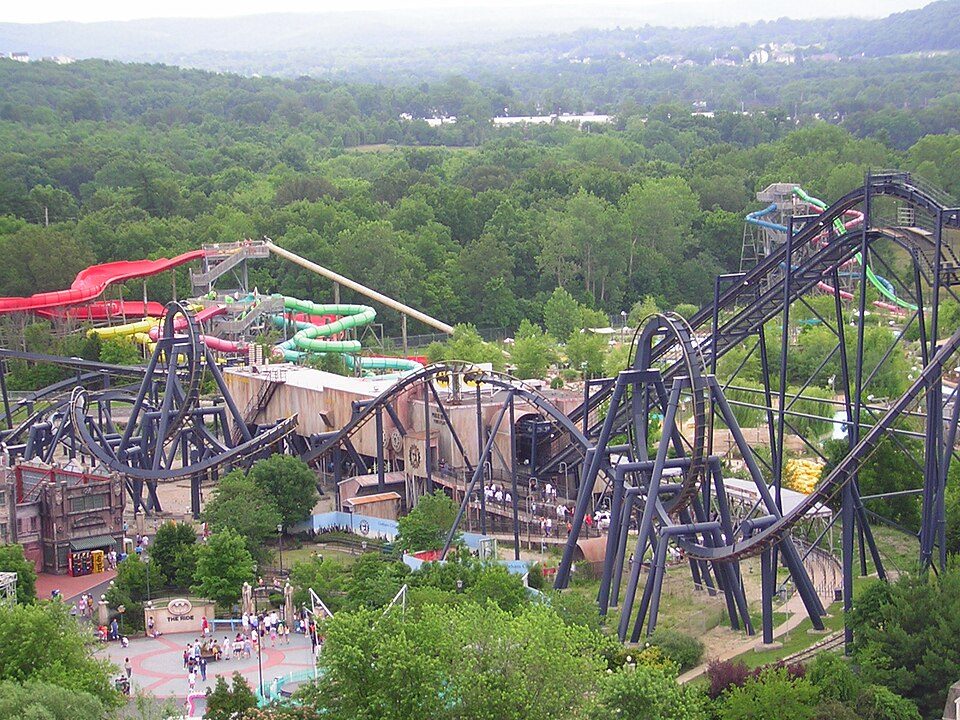 23 mi Theme parkMid America Adventure
 10 mi Stadium & arenaEnterprise Center
Cahokia: Thank You (24 Millions ) views, CC BY 2.0 · The Dome at America's Center: Paul Sableman, CC BY 2.0 · Busch Stadium: Lee Ann Ratledge, CC BY 4.0 · Gateway Arch National Park: Daniel Schwen, CC BY-SA 4.0 · Mid America Adventure: Chris Hagerman from New Port Richey, FL, US, CC BY 2.0 · Enterprise Center: Haaron755, CC BY-SA 3.0
Who provides power, water and the rest in St. John, and how to reach them.
EPA SDWIS (Oct 9, 2026) · HIFLD + EIA-861 2025 · Census 2020 ZCTAs · NCES 2024–25 · registration: vote.gov, updated Nov 18, 2024.
Ordered by what stands out in St. John.
St. John has homes that are cheap against local pay and has added a third more jobs in ten years.
23% of adults smoke cigarettes in St. John. John beats the Missouri average on 1 of 32 CDC measures and trails it on 21. 26% of adults worry about having enough food in St. John.
| St. John | Missouri towns | U.S. towns | |
|---|---|---|---|
| Smoke cigarettes (CDC PLACES) | 23% | 17% | 14% |
| Food insecurity (CDC PLACES) | 26% | 15% | 14% |
| Get no exercise (CDC PLACES) | 37% | 30% | 25% |
| Feel lonely (CDC PLACES) | 38% | 32% | 33% |
| What stands out | St. John | MO |
|---|---|---|
| Fewer adults who have had cancer | 6.6% | 8.6% |
| More adults facing a utility shut-off | 17.2% | 9% |
CDC PLACES 2025 · modeled estimates for adults · CMS · HRSA
Its public schools are run by the Ritenour school district. One of its 2 schools is below, with why it’s listed.
| School | Level | Students | Letter |
|---|---|---|---|
| Marvin Elem.Largest public elementary schoolGrades K–5 | Grades K–5 | 561 | D |
NCES · EDFacts · graded within MO on state tests and graduation
The property crime rate in St. John is 20.4 per 1,000 residents. John reports more crime per resident than most U.S. towns we grade: about 89% report less.
FBI crime data, 2025 · crimes reported to police
At 1.7 years of the St. Louis metro’s $80K median household income, the typical home (about $137K) costs less against local pay than in 95% of Missouri towns; that ratio is one input to its B for cost of living. 65.6% of renter households pay 30% or more of their income for housing, against 45.6% across Missouri.
The typical St. 59% of St. John households own their home. Typical home values rose 4% in the year to September 2026.
| St. John | Missouri towns | U.S. towns | |
|---|---|---|---|
| Households that own their home | 59% | 64% | 73% |
| Median rent | $1,159 a month | $970 a month | $1,185 a month |
Census ACS, 2020–24 · Zillow Home Value Index · Redfin Data Center
Jobs based here grew from 1,158 in 2013 to 1,562.
Most working residents leave St. Since 2013, St. John has added 404 jobs, to 1,562 in 2023. St. John’s median household income is $54,000.
| St. John | Missouri towns | U.S. towns | |
|---|---|---|---|
| Working residents who work in town | 1.3% | 13% | 8% |
| Below the poverty line | 15% | 14% | 9.6% |
| Median household income | $54,000 | $62,000 | $80,000 |
| Average trip to work | 23 minutes | 22 minutes | 25 minutes |
Census LEHD 2023 · ACS
John has chilly winters and warm summers. July afternoons reach 88°, January nights drop to 23° and about 17 inches of snow falls in a winter.
NOAA U.S. Climate Normals, 1991–2020
Expected storm and flood damage is higher than in 65% of U.S. communities. Since 1979, 12 flood insurance claims have been paid out in St. John.
FEMA flood insurance claims · FEMA National Risk Index · OpenFEMA
| St. John | Missouri towns | U.S. towns | |
|---|---|---|---|
| Conserved land | 1.9% | 2.1% | 4.3% |
| Miles of trail per square mile | 0.3 miles per square mile | 0.3 | 0.4 |
| Biggest places to walk | Trails | Acres |
|---|---|---|
| 1. Endicott Park | 0.2 mi | 12 |
| 2. Home Heights Park | — | 4 |
| 3. St. John Park | 0.2 mi | 2 |
Trails & parks © OpenStreetMap contributors · Conserved land: USGS PAD-US
24 within 15 miles of the center of St. John
About 3 of every 100 St. John residents are enrolled in college, against 6 across Missouri.
City in Missouri, United States
St. John or Saint John is a city in St. Louis County, Missouri, United States, with its commercial district centered along St. Charles Rock Road. It is a few miles southeast of Lambert-St. Louis International Airport. As of the 2020 census, the city population was 6,643.
From Wikipedia, licensed CC BY-SA 4.0 · facts via Wikidata (CC0)
6 towns share a border with St. John.
All 4 graded towns on its borders grade higher than its D−; Breckenridge Hills (D) is closest.
| Town | MO rank | Overall | Cost | Safety | Schools | Health |
|---|---|---|---|---|---|---|
| St. John | #243 | D− | B | D | D | D |
| Bel-Ridge | — | — | A− | — | D− | D− |
| Woodson Terrace | #237 | D | B | D | D | D |
| Berkeley | #235 | D | B+ | D− | C− | D− |
| Overland | #206 | D | B+ | D | D | C− |
| Breckenridge Hills | #242 | D | B+ | D | D | D |
| Charlack | — | — | B | — | D | C− |
Bel-Ridge and Charlack have fewer than 2,500 residents, so they get subject grades but no overall grade. Bel-Ridge and Charlack report no FBI crime data of their own. Compare St. John with a neighbor →
Short answers, built from the data on this page.
St. John grades D− overall, better than 4% of U.S. towns and #243 of 247 in Missouri. It grades D for health, D for safety and D for schools. Health is its weak spot, with a D.
Louis, MO-IL metro area). Cost of living, which also weighs rents, property taxes and how many households pay 30% or more of their income for housing, grades B.


