
MIMap-doton-Sheridan, 2005
Sheridan Township’s story
Sheridan Township in pictures
Census counts: 661 in 1880, 692 in 2020. The archive holds 1 old photo or paper going back to 2005 and 2 maps from 1958 on.
Explore the history →Each edition grades its towns against each other only.
A town of 2,581. 42% more nonprofits per person than the typical Michigan town.
Sheridan Township is a solid, middle-of-the-road choice. It grades B− overall, 402nd among Michigan's 697 graded towns, with no subject far below average. Its best mark is schools: its public schools beat 60% of Michigan towns on state tests and graduation. Its lowest everyday mark is in health: residents are less healthy than 64% of U.S. towns on CDC estimates. A typical home there costs about $299K, 4.7 years of the county’s $63K median household income. Sheridan Township's civic life (library use, community groups, volunteering) is stronger than in 89% of U.S. towns. 24% of residents are 65 or older in Sheridan Township, above both Michigan’s towns (19%) and U.S. towns (18%).
Where Sheridan Township beats most towns.
Where Sheridan Township’s working residents go each day. Line width shows the share.
Census LEHD 2021
Each subject compared with towns across the country (schools within Michigan), ordered by how far Sheridan Township is from typical.
How TownRatings grades towns →
Census counts: 661 in 1880, 692 in 2020. The archive holds 1 old photo or paper going back to 2005 and 2 maps from 1958 on.
Explore the history →Who provides power, water and the rest in Sheridan Township, and how to reach them.
EPA SDWIS (Oct 9, 2026) · HIFLD + EIA-861 2025 · Census 2020 ZCTAs · NCES 2024–25 · registration: vote.gov, updated Sep 12, 2025.
Ordered by what stands out in Sheridan Township.
The top destinations are Fremont (16%), Grand Rapids (9%) and Muskegon (6%). Commuting out is the norm in Sheridan Township: 4% of working residents work locally. Jobs in Sheridan Township grew by 312 from 2011 to 2021, reaching 553. The town’s mean commuting time stands at 21 minutes.
| Sheridan Township | Michigan towns | U.S. towns | |
|---|---|---|---|
| Average trip to work | 21 minutes | 25 minutes | 25 minutes |
| Work from home | 7.5% | 10% | 11% |
| Working residents who work in town | 4.4% | 5.9% | 8% |
| Below the poverty line | 8.1% | 8.9% | 9.6% |
Census LEHD 2021 · ACS
FEMA expects less storm and flood damage in Sheridan Township than in 73% of U.S. communities. 2 flood insurance claims have been paid here since 1986.
FEMA flood insurance claims · FEMA National Risk Index · OpenFEMA
26% of Sheridan Township residents are under 18. The Census Bureau’s 2025 estimate puts Sheridan Township at 2,581 residents, up 2.5% since 2020. The midpoint age locally is 38.6 years.
| Sheridan Township | Michigan towns | U.S. towns | |
|---|---|---|---|
| Under 18 | 26% | 21% | 22% |
| Median age | 38.6 years | 42.5 years | 40.5 years |
48% women, 52% men
That’s an even split within the survey’s margin of ±3.8 points. Across Michigan, 50.4% of residents are women.
| Sheridan Township | MI | U.S. | |
|---|---|---|---|
| Under 10 | 12.9% | 11.2% | 11.6% |
| 10 to 17 | 12.6% | 10.1% | 10.3% |
| 18 to 24 | 7.2% | 9.2% | 9.1% |
| 25 to 34 | 14.1% | 13.2% | 13.7% |
| 35 to 44 | 10.1% | 12.2% | 13.2% |
| 45 to 54 | 7.9% | 12% | 12.2% |
| 55 to 64 | 10.7% | 13.6% | 12.7% |
| 65 to 74 | 16.1% | 11.2% | 10.2% |
| 75 and older | 8.3% | 7.4% | 7% |
| No diploma | 5.6% | 7.9% | 10.4% |
| High school | 34% | 28% | 26% |
| Some college | 25% | 21.9% | 19.1% |
| Associate’s | 11.1% | 9.8% | 8.8% |
| Bachelor’s | 16.8% | 19.7% | 21.6% |
| Graduate | 7.4% | 12.7% | 14.1% |
Census population estimates, 2025 · U.S. Census Bureau · ACS 2020-2024 5-year estimates · in a town of 2,600, single groups can be off by several points
5.4 miles of trail in 1 park or preserve. Parks and preserves in Sheridan Township: one, of 13 acres. For Sheridan Township, the concentration of trails is 0.2 miles per square mile.
| Sheridan Township | Michigan towns | U.S. towns | |
|---|---|---|---|
| Conserved land | 1.6% | 4.4% | 4.3% |
| Miles of trail per square mile | 0.2 miles per square mile | 0.3 | 0.4 |
| Biggest places to walk | Trails | Acres |
|---|---|---|
| 1. Sheridan Park | — | 13 |
Trails & parks © OpenStreetMap contributors · Conserved land: USGS PAD-US
The range runs from 16° on a January night to 82° on a July afternoon, with about 75 inches of snow a winter.
NOAA U.S. Climate Normals, 1991–2020
Among adults in Sheridan Township, 27% get no exercise outside work. 32% of adults in Sheridan Township sleep under 7 hours; 16% report frequent physical distress.
| Sheridan Township | Michigan towns | U.S. towns | |
|---|---|---|---|
| High blood pressure (CDC PLACES) | 39% | 36% | 35% |
| Sleep under 7 hours (CDC PLACES) | 32% | 34% | 36% |
| Frequent physical distress (CDC PLACES) | 16% | 14% | 14% |
| Feel lonely (CDC PLACES) | 31% | 32% | 33% |
| What stands out | Sheridan Township | MI |
|---|---|---|
| More older adults who have lost all their teeth | 13.7% | 10.2% |
| More adults with COPD | 9.9% | 8.1% |
| More adults with heart disease | 8.4% | 7% |
CDC PLACES 2025 · modeled estimates for adults · CMS · HRSA
The typical home value in Sheridan Township is about $299,000, up 8.7% in a year, 13% above the Michigan typical home. In Sheridan Township, just over nine in ten households live in a home they own. For Sheridan Township, the median rent is $1,016 a month.
| Sheridan Township | Michigan towns | U.S. towns | |
|---|---|---|---|
| Households that own their home | 91% | 84% | 73% |
| Median rent | $1,016 a month | $1,047 a month | $1,185 a month |
Census ACS, 2020–24 · Zillow Home Value Index · Redfin Data Center
Museums, parks, gardens and other places to visit around Sheridan Township. Close and well known come first.
 35 mi MuseumGerald R. Ford Presidential Museum
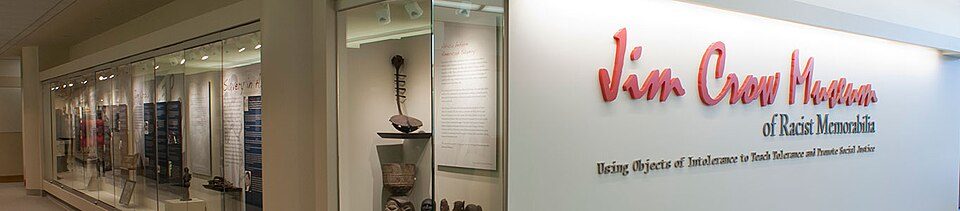 31 mi MuseumJim Crow Museum of Racist Memorabilia
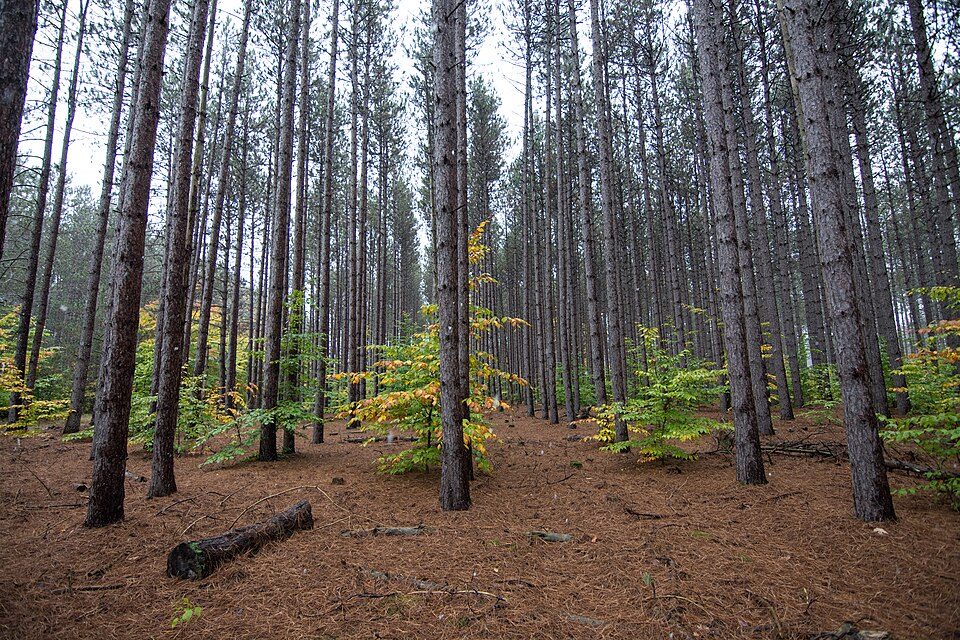 32 mi National forestManistee National Forest
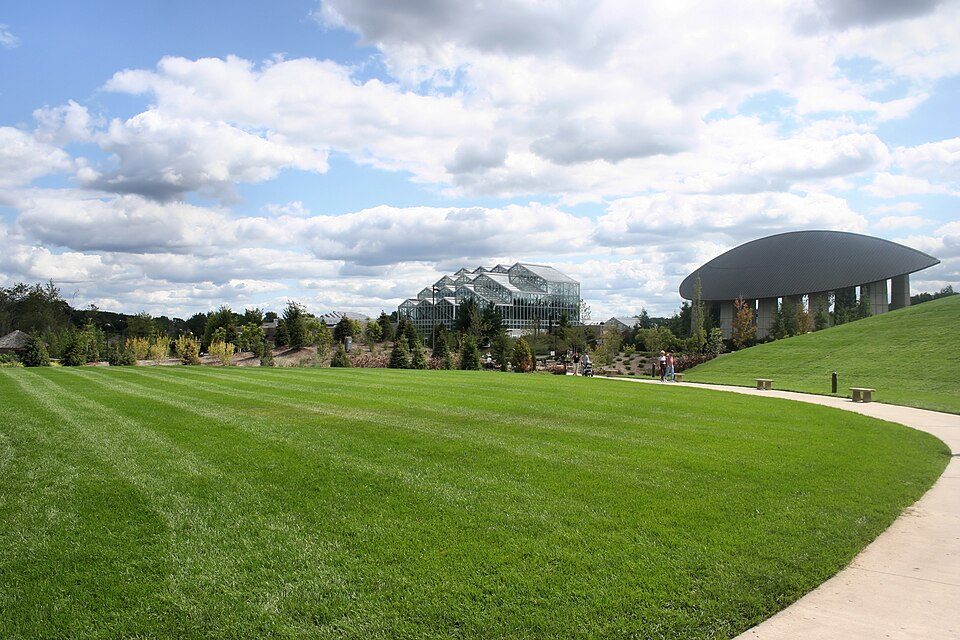 36 mi MuseumFrederik Meijer Gardens & Sculpture Park
 19 mi MuseumUSS LST-393
Gerald R. Ford Presidential Museum: Staff of the Gerald R. Ford Presidential Museum, Public domain · Jim Crow Museum of Racist Memorabilia: Jim Crow Museum, CC BY-SA 4.0 · Manistee National Forest: RomanKahler, CC BY-SA 4.0 · Frederik Meijer Gardens & Sculpture Park: User Jeffness on en.wikipedia, CC BY-SA 2.5 · USS LST-393: USN, Public domain
None within 15 miles of Sheridan Township; the nearest are
About 3 of every 100 Sheridan Township residents are enrolled in college, against 6 across Michigan.
6 towns share a border with Sheridan Township.
| Town | MI rank | Overall | Cost | Safety | Schools | Health |
|---|---|---|---|---|---|---|
| Sheridan Township | #402 | B− | B | — | B | C+ |
| Fremont | #376 | B− | B− | — | B | C |
| Bridgeton Township | — | — | B− | — | B− | C+ |
| Garfield Township | #541 | C | C+ | — | B | C |
| Holton Township | #588 | C− | B+ | — | C | C− |
| Dayton Township | — | — | C+ | — | B | C+ |
| Ashland Township | #374 | B− | B+ | — | B− | C+ |
Bridgeton Township and Dayton Township have fewer than 2,500 residents, so they get subject grades but no overall grade. Sheridan Township, Fremont, Bridgeton Township, Garfield Township, Holton Township, Dayton Township and Ashland Township report no FBI crime data of their own. Compare Sheridan Township with a neighbor →
Short answers, built from the data on this page.
Sheridan Township grades B− overall, better than 50% of U.S. towns and #402 of 697 in Michigan. It grades C+ for health and B for schools.
Cost of living, which also weighs rents, property taxes and how many households pay 30% or more of their income for housing, grades B.


