211 years in pictures
Census counts: 143 in 1910, a low of 97 in 1930, 2,102 in 2020. The archive holds 3 maps from 1950 on.
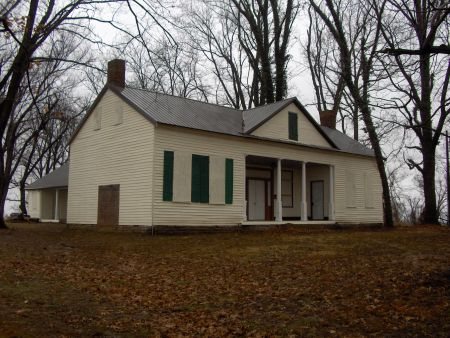
1 place on the National Register of Historic Places.
- 1815Dry Ridge is settled
Each edition grades its towns against each other only.

A town of 2,249, settled in 1815.
Dry Ridge’s best subject grades are an A− for cost of living and walkability; its weakest is a D for incomes. On hazard risk, just 15 of Kentucky’s 238 towns do better. 22% of residents live below the poverty line in Dry Ridge, against 16% in Kentucky’s towns and 9.6% across U.S. towns. Dry Ridge's civic life (library use, community groups, volunteering) trails 96% of U.S. towns. Sherman Tavern is on the National Register of Historic Places. Dry Ridge has fewer than 2,500 residents, so it gets subject grades but no overall grade.
Where Dry Ridge beats most towns.
Where Dry Ridge’s working residents go each day. Line width shows the share.
Census LEHD 2023
Each subject compared with towns across the country (schools within Kentucky), ordered by how far Dry Ridge is from typical.
How TownRatings grades towns →
Census counts: 143 in 1910, a low of 97 in 1930, 2,102 in 2020. The archive holds 3 maps from 1950 on.
1 place on the National Register of Historic Places.
Who provides power, water and the rest in Dry Ridge, and how to reach them.
EPA SDWIS (Oct 9, 2026) · HIFLD + EIA-861 2025 · Census 2020 ZCTAs · NCES 2024–25 · registration: vote.gov, updated Nov 18, 2024.
Ordered by what stands out in Dry Ridge.
Most working residents leave Dry Ridge for work: only 8% work in town. Jobs based in Dry Ridge grew to 1,873 in 2023, 408 more than in 2013. At $56,000, Dry Ridge’s median household income is where Kentucky’s towns sit at $60,000 and U.S. towns at $80,000.
| Dry Ridge | Kentucky towns | U.S. towns | |
|---|---|---|---|
| Median household income | $56,000 | $60,000 | $80,000 |
| Average trip to work | 22 minutes | 22 minutes | 25 minutes |
| Working residents who work in town | 8.2% | 15% | 8% |
Census LEHD 2023 · ACS
Its public schools are run by the Grant County school district. Two of its 4 schools are below, each with why it’s listed. The largest public high school is Grant County High School, with 1,016 students.
| School | Level | Students | Letter |
|---|---|---|---|
| Grant County Middle SchoolLargest public middle schoolGrades 6–8 | Grades 6–8 | 699 | C+ |
| Grant County High SchoolLargest public high schoolGrades 9–12 | Grades 9–12 | 1,016 | B− |
NCES · EDFacts · graded within KY on state tests and graduation
The FEMA risk score in Dry Ridge is 10 of 100.
FEMA National Risk Index · OpenFEMA
Dry Ridge beats the Kentucky average on 2 of 31 CDC measures and trails it on 9. 43% of adults sleep under 7 hours in Dry Ridge. Among 142 Kentucky towns, just 10 have a lower share of adults who had a checkup this year than Dry Ridge.
| Dry Ridge | Kentucky towns | U.S. towns | |
|---|---|---|---|
| Sleep under 7 hours (CDC PLACES) | 43% | 40% | 36% |
| Depression (CDC PLACES) | 29% | 27% | 23% |
| Frequent mental distress (CDC PLACES) | 20% | 18% | 17% |
| Yearly checkup (CDC PLACES) | 76% | 79% | 79% |
| What stands out | Dry Ridge | KY |
|---|---|---|
| Fewer adults with heart disease | 7.2% | 8.2% |
| Fewer adults who have had cancer | 7.8% | 8.7% |
| More uninsured adults | 8.3% | 5.4% |
CDC PLACES 2025 · modeled estimates for adults · CMS · HRSA
The typical Dry Ridge home is worth about $285,000, up 3.9% in a year, 23% above the Kentucky typical home. 42% of Dry Ridge households own their home.
| Dry Ridge | Kentucky towns | U.S. towns | |
|---|---|---|---|
| Households that own their home | 42% | 59% | 73% |
| Median rent | $811 a month | $934 a month | $1,185 a month |
Census ACS, 2020–24 · Zillow Home Value Index · Redfin Data Center
Dry Ridge has chilly winters and warm summers. July afternoons reach 86°, January nights drop to 23° and about 16 inches of snow falls in a winter.
NOAA U.S. Climate Normals, 1991–2020
Dry Ridge’s property crime rate is 19.8 per 1,000 residents.
| Dry Ridge | Kentucky towns | U.S. towns | |
|---|---|---|---|
| Property crimes per 1,000 (2025) | 19.8 per 1,000 residents | 8.3 | 9.9 |
| Violent crimes per 1,000 (2025) | 0.5 per 1,000 residents | 1.3 | 1.6 |
FBI crime data, 2025 · crimes reported to police
| Biggest places to walk | Trails | Acres |
|---|---|---|
| 1. Piddle Park | 0.2 mi | 6 |
Trails & parks © OpenStreetMap contributors · Conserved land: USGS PAD-US
None within 15 miles of Dry Ridge; the nearest are
About 5 of every 100 Dry Ridge residents are enrolled in college, about the same as Kentucky.
City in Kentucky, United States
Dry Ridge is a home rule-class city in Grant County, Kentucky, in the United States. As of the 2020 census, Dry Ridge had a population of 2,102. From around 1910 to 1960, the city's economy was dominated by business related to its mineral water wells, purported to have healing properties.
From Wikipedia, licensed CC BY-SA 4.0 · facts via Wikidata (CC0)
One town shares a border with Dry Ridge.
| Town | KY rank | Overall | Cost | Safety | Schools | Health |
|---|---|---|---|---|---|---|
| Dry Ridge | — | — | A− | B | C | C− |
| Williamstown | #33 | A− | A | A | C | C+ |
Dry Ridge has fewer than 2,500 residents, so it gets subject grades but no overall grade. Compare Dry Ridge with a neighbor →
Short answers, built from the data on this page.
Not for the area. Cost of living, which also weighs rents, property taxes and how many households pay 30% or more of their income for housing, grades A−.