Guest, Sign inJoin

Post to Bowling Green

We’ll email a one-tap link to publish your post. No password, and nothing is public until you click it.
Already a member? Sign in
Fountain Square Park, Bowling Green, Kentucky
Kentucky›Warren County
Photo: OPMaster (talk) · CC BY-SA 3.0
Photo of Bowling Green

Bowling Green, KY · Photo: OPMaster (talk) · CC BY-SA 3.0 · Source ↗

Is Bowling Green a good place to live?

Bowling Green earns a D, 124th among Kentucky's 138 graded towns, mostly because of safety and incomes. It reports more crime per resident than 80% of U.S. towns, including 148 violent crimes reported to the FBI in 2025. The median household income is $49K, and 26% of residents live below the poverty line. What it does well: it is easier to get around on foot or by transit than 82% of U.S. towns. 57% of working residents work locally in Bowling Green, against 15% in Kentucky’s towns and 8% across U.S. towns. Its National Register listings include Warren County Courthouse and Riverview. On cost of living, just 23 of Kentucky’s 238 towns do worse.

What makes Bowling Green stand out

Where Bowling Green beats most towns.

Riverview
Riverview · National Register of Historic Places
Bowling Green’s story

228 years in pictures

Its 67 National Register listings are more than in 99% of Kentucky towns with a listing.

Census counts: 41 in 1800, 72,294 in 2020. The archive holds 17 old photos and papers going back to 1862 and 5 maps from 1921 on.

  • 1798Bowling Green is settled
Explore the history →

How Bowling Green grades

Each subject compared with towns across the country (schools within Kentucky), ordered by how far Bowling Green is from typical.

How grading works
Character Graded, but not part of the overall grade.
Described, not graded Taste, not quality: snow or an older crowd is neither good nor bad.

How TownRatings grades towns →

Getting set up

Moving to Bowling Green: who provides what

Who provides power, water and the rest in Bowling Green, and how to reach them.

The full setup list →
PowerCity of Bowling Green12.2¢/kWh · EIA 2025HIFLD · EIA
WaterBowling Green Municipal UtilitiesNo health-based violations in 5 years · EPAEPA
Internet5 providers97% of addresses get 100/20 MbpsFCC
Trash & dumpNot on file yetWe don’t have Bowling Green’s trash rules yet
SchoolsWarren County School DistrictWhich school depends on your addressNCES
Register to voteOnlineIn Kentucky you can register online until 29 days before Election Day, in person until 29 days before Election Day, or by mail (postmarked 29 days before).vote.gov
Who runs elections hereWarren County ClerkWarren County; contacts on the Handbook page.FVAP, Feb 2019
ZIP codes42101, 42104, 4210342101 54% · 42104 26% · 42103 20%Census 2020

EPA SDWIS (Oct 9, 2026) · HIFLD + EIA-861 2025 · Census 2020 ZCTAs · NCES 2024–25 · registration: vote.gov, updated Nov 18, 2024.

The data

Ordered by what stands out in Bowling Green.

Bowling Green has hotter summers than almost anywhere else in Kentucky and draws workers from Glasgow and beyond, but it carries more natural-hazard risk than most of Kentucky (mostly inland flooding).

OutdoorsB

2.8% of Bowling Green is conserved land

43 miles of trail in 22 parks and preserves. Bowling Green’s trail density is 1.0 miles per square mile. The biggest place to walk is Hobson Grove Park, 229 acres with 2.6 miles of trail.

#9for trails in KY
Bowling GreenKentucky townsU.S. towns
Miles of trail per square mile1.0 miles per square mile0.30.4
Conserved land2.8%1.7%4.3%
2.8%
conserved · 761 of 26,920 acres
43 mi
of trails · 1 per sq mi
Biggest places to walkTrailsAcres
1. Hobson Grove Park2.6 mi229
2. Weldon Peete Park2.2 mi81
3. Preston S Miller Park1.9 mi58

Trails & parks © OpenStreetMap contributors · Conserved land: USGS PAD-US

SchoolsB+

On state tests, Bowling Green’s schools beat 70% of Kentucky districts

Its public schools are run by the Warren County school district. Three of its 35 schools are below, each with why it’s listed.

70%of KY districts it outscoresB+School Grade
SchoolLevelStudentsLetter
Bowling Green Junior HighLargest public middle schoolGrades 6–8Grades 6–81,042A−
Greenwood High SchoolLargest public high schoolGrades 9–12Grades 9–121,451A−
Potter Gray ElementaryTop results in townGrades K–5Grades K–5499A+

NCES · EDFacts · graded within KY on state tests and graduation

Work & commuteJobs & income grade C−

More than half of Bowling Green’s working residents work in town

58,106 jobs are based in Bowling Green, 2.1 for every working resident, so most of the people who work here commute in. The average commute takes 17.8 minutes, against 24 across Kentucky.

The average trip to work in Bowling Green is 18 minutes. Jobs based in Bowling Green grew to 58,106 in 2023, 7,899 more than in 2013. 6.3% of Bowling Green workers work from home.

57%work in town
Bowling GreenKentucky townsU.S. towns
Average trip to work18 minutes22 minutes25 minutes
Median household income$49,000$60,000$80,000
Work from home6.3%10%11%

Where working residents work

In Bowling Green57%
Franklin4%
Nashville2%
Louisville2%
Lexington2%
5 mi
median commute distance
58,106
jobs based in Bowling Green
A job hub
jobs vs. working residents
A−
Walkability grade: more walkable than 82% of U.S. towns

Census LEHD 2023 · ACS

SafetyC−

Bowling Green earns a C− for safety

Reported crimes fell from 2,409 to 1,971 over the last three FBI years, a drop beyond ordinary year-to-year swings.

Bowling Green reports more crime per resident than most U.S. towns we grade: about 80% report less. Among 115 Kentucky towns, just 10 have a higher property crime rate than Bowling Green.

20%of U.S. towns report more crimeC−Safety Grade
Bowling GreenKentucky townsU.S. towns
Property crimes per 1,000 (2025)22.6 per 1,000 residents8.29.9
Violent crimes per 1,000 (2025)1.8 per 1,000 residents1.31.6

Violent crime per 1,000 residents

Bowling Green1.8
Kentucky2.2
U.S.3.3

Property crime per 1,000 residents

Bowling Green22.6
Kentucky12.8
U.S.15.5
20th
percentile among U.S. towns we grade
11th
percentile among KY towns
148
violent crimes reported in 2025
1,823
property crimes reported in 2025

FBI crime data, 2025 · crimes reported to police

Natural hazardsHazard risk grade D

Inland flooding leads a very high hazard risk in Bowling Green

FEMA rates its natural-hazard risk higher than 88% of Kentucky towns, with expected losses of about $550 per resident a year; that rating is what its D for hazard risk is built on.

Since 1978, 65 flood insurance claims have been paid out in Bowling Green.

81risk score of 100
FEMA risk score
81Very high riskLowerHigher
Inland floodingHailTornadoes
65
paid flood claims since 1978
8
federal disasters paid out here

FEMA flood insurance claims · FEMA National Risk Index · OpenFEMA

Who lives here

More young adults than Kentucky overall

Only 36.6% of households own their home, against 68.3% across Kentucky.

Adults 18 to 34 are 36% of residents (22% statewide); adults 35 to 64 are 29% of residents (38% statewide). 11% of residents are 65 or older in Bowling Green. Bowling Green has grown 8.6% since 2020, to 78,505 residents in the Census Bureau’s 2025 estimate.

28.7median age · KY 39.1
Bowling GreenKentucky townsU.S. towns
Median age28.7 years37.6 years40.5 years
Aged 65 or older11%17%18%
Bachelor’s degree or more, 25+31%26%29%
Bowling GreenKentuckyUnited States

Ages · share of residents

Education · adults 25 and older

No diploma15%
High school26%
Some college21%
Associate’s7%
Bachelor’s18%
Graduate13%

Women and men · all residents

50% women, 50% men

That’s an even split within the survey’s margin of ±1 point. Across Kentucky, 50.5% of residents are women. Median age: women 29.2, men 28.2.

Ages and education in Bowling Green
Bowling GreenKYU.S.
Under 1012.7%12.1%11.6%
10 to 1710%10.5%10.3%
18 to 2421.5%9.1%9.1%
25 to 3414.9%13.1%13.7%
35 to 4412.1%12.6%13.2%
45 to 549%12.3%12.2%
55 to 648.3%13%12.7%
65 to 746.4%10.5%10.2%
75 and older5%6.8%7%
No diploma14.6%11.1%10.4%
High school26.3%32.6%26%
Some college21.1%19.7%19.1%
Associate’s6.8%9%8.8%
Bachelor’s18%16.2%21.6%
Graduate13.2%11.3%14.1%

Census population estimates, 2025 · U.S. Census Bureau · ACS 2020-2024 5-year estimates

HealthC

Bowling Green is less healthy than 74% of U.S. towns

Against the 5,341 U.S. towns with household incomes like Bowling Green’s, it is healthier than 62%, so its C isn’t only a matter of income. Within Kentucky it is less healthy than 53% of the 141 graded towns: much of Kentucky scores lower on these measures.

Bowling Green beats the Kentucky average on 7 of 31 CDC measures and trails it on 9. Only 7 of the 141 Kentucky towns we compare have a lower share of adults who had a checkup this year than Bowling Green.

26%healthier than U.S. townsCHealth Grade
Bowling GreenKentucky townsU.S. towns
Frequent mental distress (CDC PLACES)21%18%17%
Food insecurity (CDC PLACES)23%16%14%
Yearly checkup (CDC PLACES)76%79%79%
High blood pressure (CDC PLACES)32%38%35%
31 measures vs. Kentucky
7 better15 too close to call9 worse
What stands outBowling GreenKY
Fewer adults who have had cancer6.1%8.7%
Fewer adults with heart disease6.3%8.2%
More uninsured adults9%5.4%
Tristar Greenview Regional Hospital
0.8 mi away · emergency room
3 of 3
care shortages: primary care, dental, mental health
47th
percentile among KY towns

CDC PLACES 2025 · modeled estimates for adults · CMS · HRSA

HousingCost of living grade C

A typical Bowling Green home is worth about $280K

The typical Bowling Green home is worth about $280,000, about the same as a year ago, 21% above the Kentucky typical home. Only 5 of the 142 Kentucky towns we compare have a lower share of households owning their home than Bowling Green.

$280KZillow home value
Bowling GreenKentucky townsU.S. towns
Households that own their home37%59%73%
Renters paying 30%+ of income on rent50%44%48%
Median rent$998 a month$930 a month$1,185 a month

Typical home value

Bowling Green$280K
Kentucky$231K
Market temperature
BalancedA balanced marketBuyer’sSeller’s
92
days on market
96.2%
sale-to-list price
+0.1%
value change, 1 year
56
homes sold in May

Census ACS, 2020–24 · Zillow Home Value Index · Redfin Data Center

Climate

Compared with most of Kentucky and the rest of the country, a typical July afternoon in Bowling Green is hotter

July afternoons average 89.4°, the #2 highest of 554 Kentucky places with climate records; January nights average 27.5°.

Of the 142 Kentucky towns we compare, none has a higher July high than Bowling Green. Bowling Green has chilly winters and warm summers, with plenty of rain. Among 142 Kentucky towns, just 2 have a higher January low than Bowling Green.

9″snow a winter
Bowling GreenKentucky townsU.S. towns
July high89°F87°F85°F
January low28°F25°F22°F

Typical low → high °F

Winter30–48°
Spring46–70°
Summer66–88°
Fall47–71°
Oct 31
typical first frost
Apr 5
typical last frost
+1.0°
vs. the 20th-century average

NOAA U.S. Climate Normals, 1991–2020

Nearby attractions

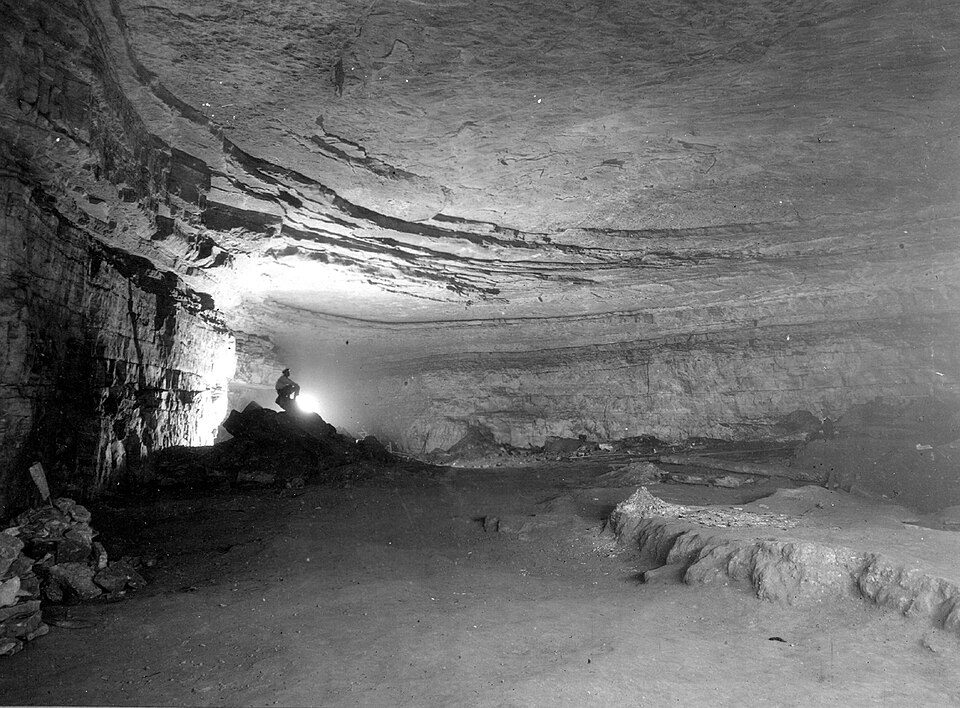
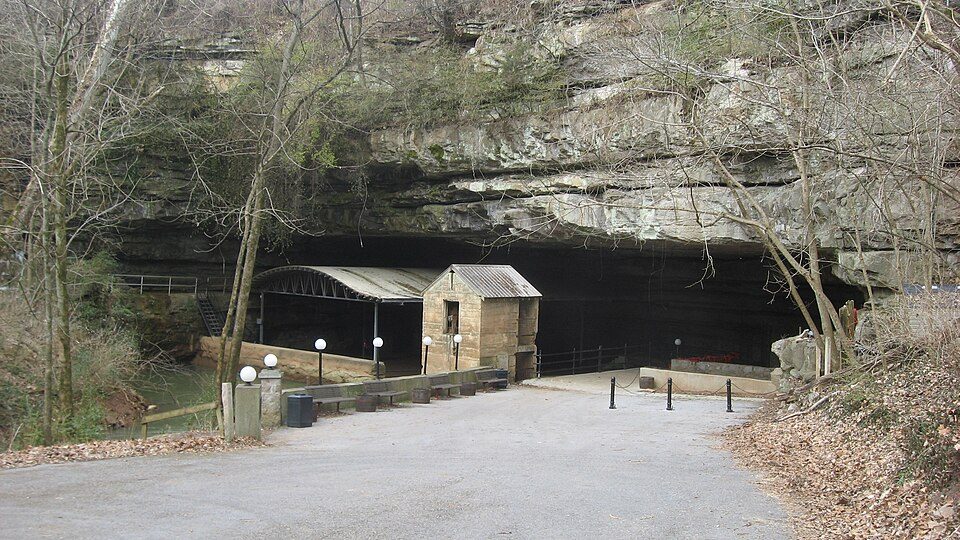
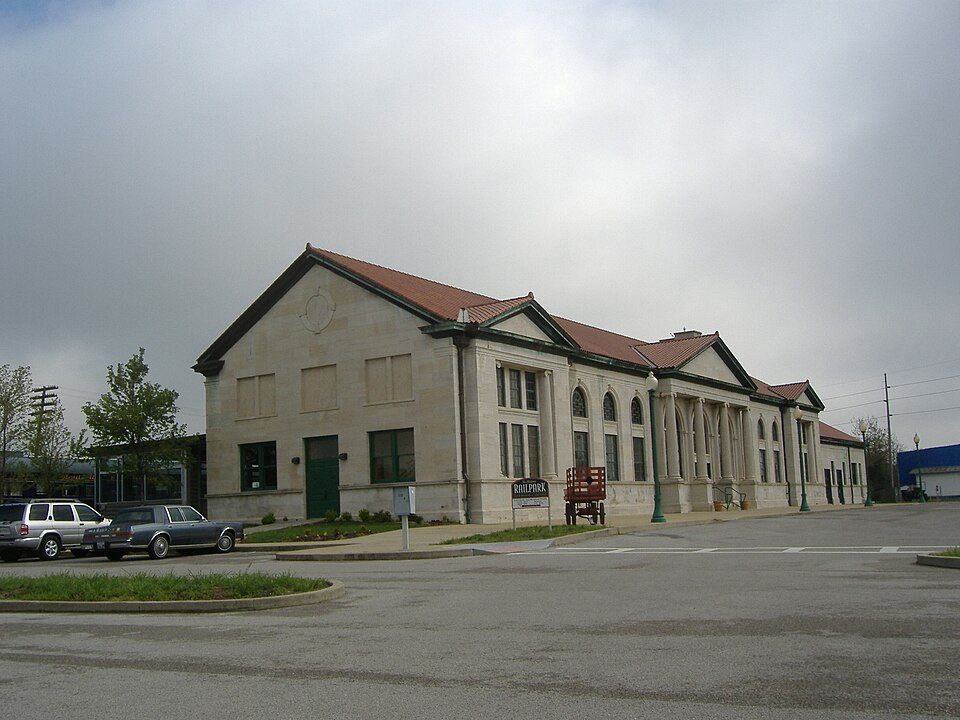
Mammoth Cave National Park and 6 more within 40 miles

Museums, parks, gardens and other places to visit around Bowling Green. Close and well known come first.

All 27 attractions →
Sources: National Park Service · ski areas © OpenSkiMap / OpenStreetMap contributors · Wikidata · Wikipedia readership · photos via Wikimedia Commons
Photo credits

Mammoth Cave National Park: Willis Thomas Lee, Public domain · National Corvette Museum: Jonrev at English Wikipedia, Public domain · Lost River Cave: Nyttend, Public domain · Beech Bend Park: Acdixon, CC0 · The Historic Railpark and Train Museum: Bedford at en.wikipedia, Public domain

Keep exploring

Everything we know about Bowling Green

20pages on Bowling Green
After high school

Colleges nearby

2 within 15 miles of the center of Bowling Green

A growing town

Bowling Green has grown 35% since 2010

58,067 counted in 2010 and 72,294 in 2020; an estimated 78,505 in 2025.

Growth hasn’t slowed: 8.6% since 2020, after 24.5% in the decade before.

58,0672010
72,2942020
78,5052025 est.

U.S. Census 2010 & 2020 counts · Census Bureau estimate, July 1, 2025

Landmarks

67 places in Bowling Green on the National Register of Historic Places.

All landmarks →

Famous people from Bowling Green

47 notable people were born in Bowling Green.

See all 47 →

About Bowling Green

City in Kentucky, United States

Official town website ↗

Bowling Green is a city in and the county seat of Warren County, Kentucky, United States. Its population was 72,294 as of the 2020 census, making it the third-most populous city in the state, after Louisville and Lexington. The Bowling Green metropolitan area is the fourth-largest in the state and had a population of 179,639 in 2020. Founded by pioneers in 1798, Bowling Green was the provisional capital of Confederate Kentucky during the American Civil War. In the 21st century, it is the location of numerous manufacturers, including General Motors, Spalding, and Fruit of the Loom. The Bowling Green Assembly Plant has been the source of all Chevrolet Corvettes built since 1981. Bowling Green…

From Wikipedia, licensed CC BY-SA 4.0 · facts via Wikidata (CC0)

Established
1798
Area
39 sq mi
Elevation
5,469 ft
ZIP code
42101, 42102, 42103
Area code
270, 364

Bowling Green’s neighbors

One town shares a border with Bowling Green.

Explore the map →
Plum SpringsPlum SpringsBowling Green
How the neighbors grade
TownKY rankOverallCostSafetySchoolsHealth
Bowling Green#124DCC−B+C
Plum Springs——————

Plum Springs isn’t graded (fewer than 1,000 residents, or not enough data). Compare Bowling Green with a neighbor →

Questions about Bowling Green

Short answers, built from the data on this page.

Is Bowling Green, KY a good place to live?

Bowling Green grades D overall, better than 14% of U.S. towns and #124 of 138 in Kentucky. It grades C for health, C− for safety and B+ for schools. Hazard risk is its weak spot, with a D.

Is Bowling Green, KY expensive?

That is 4.4 years of the area's median household income ($63,328 across the Bowling Green, KY metro area). Cost of living, which also weighs rents, property taxes and how many households pay 30% or more of their income for housing, grades C.

What is Bowling Green, KY known for?

47 notable people were born here, including Bill Pope and Francis McDonald.