185 years in pictures
Census counts: 1,435 in 1860, 8,701 in 2020. The archive holds 6 old photos and papers going back to 1860 and 2 maps from 1949 on.
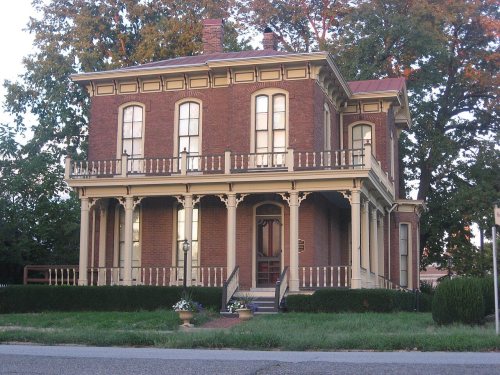
4 places on the National Register of Historic Places.
- 1841Olney is settled
Each edition grades its towns against each other only.

Olney gives you more for your money than most places: homes are within reach, about $138K for a typical one, or 2.2 years of the county’s $62K median household income. It grades B− overall, ranked 498th of 767 in Illinois. The low prices come with trade-offs. The median household income is $60K, and 14% of residents live below the poverty line. On the plus side, it is easier to get around on foot or by transit than 80% of U.S. towns. 34% of working residents work locally in Olney, above both the Illinois town median (8.3%) and the median of U.S. towns (8%). Olney is home to Illinois Eastern Community Colleges. Olney has 4 places on the National Register.
Where Olney beats most towns.
LarchmoundEach subject compared with towns across the country (schools within Illinois), ordered by how far Olney is from typical.
How TownRatings grades towns →
Census counts: 1,435 in 1860, 8,701 in 2020. The archive holds 6 old photos and papers going back to 1860 and 2 maps from 1949 on.
4 places on the National Register of Historic Places.
Who provides power, water and the rest in Olney, and how to reach them.
EPA SDWIS (Oct 9, 2026) · HIFLD + EIA-861 2025 · Census 2020 ZCTAs · NCES 2024–25 · registration: vote.gov, updated Sep 12, 2025.
Ordered by what stands out in Olney.
Olney trades lower home prices for longer drives to work, is healthier than towns with similar incomes and has seen reported crime fall by a third or more.
Homes are within reach (about $138K for the typical one, A− for cost of living), but half of working residents commute more than 21 miles. The median property tax bill is $1,893, against $5,298 across Illinois, another input to its cost-of-living grade.
The median rent in Olney is $809 a month. Typical home values rose 8% in the year to September 2026. 65% of Olney households own their home.
| Olney | Illinois towns | U.S. towns | |
|---|---|---|---|
| Median rent | $809 a month | $1,129 a month | $1,185 a month |
| Households that own their home | 65% | 75% | 73% |
Census ACS, 2020–24 · Zillow Home Value Index · Redfin Data Center
2.0 miles of trail in 2 parks and preserves. The biggest park or preserve is Olney City Park, at 53 acres.
| Olney | Illinois towns | U.S. towns | |
|---|---|---|---|
| Conserved land | 2.2% | 3.7% | 4.3% |
| Miles of trail per square mile | 0.3 miles per square mile | 0.3 | 0.4 |
| Biggest places to walk | Trails | Acres |
|---|---|---|
| 1. Alvin Musgrove Park | 1.2 mi | 49 |
| 2. Olney City Park | 0.7 mi | 53 |
Trails & parks © OpenStreetMap contributors · Conserved land: USGS PAD-US
Against the 8,898 U.S. towns with household incomes like Olney’s, it is healthier than 51%, so its C isn’t only a matter of income.
Olney beats the Illinois average on 1 of 32 CDC measures and trails it on 11. 15% of adults report frequent physical distress in Olney.
| Olney | Illinois towns | U.S. towns | |
|---|---|---|---|
| Frequent physical distress (CDC PLACES) | 15% | 13% | 14% |
| Obesity (CDC PLACES) | 40% | 37% | 35% |
| Smoke cigarettes (CDC PLACES) | 16% | 13% | 14% |
| High blood pressure (CDC PLACES) | 38% | 35% | 35% |
| What stands out | Olney | IL |
|---|---|---|
| Fewer uninsured adults | 8.1% | 9.9% |
| More older adults who have lost all their teeth | 16.1% | 10.3% |
CDC PLACES 2025 · modeled estimates for adults · CMS · HRSA
Olney has chilly winters and warm summers. Olney’s July high is 87°F.
NOAA U.S. Climate Normals, 1991–2020
The average commute for its 3,217 working residents takes 17.2 minutes, against 27.8 across Illinois.
About one in 3 of Olney’s working residents works in town. Since 2013, Olney has lost 883 jobs, to 3,582 in 2023. The top destinations are Olney Township (7%), Flora (2%) and Salem (2%).
| Olney | Illinois towns | U.S. towns | |
|---|---|---|---|
| Average trip to work | 17 minutes | 26 minutes | 25 minutes |
| Work from home | 5% | 11% | 11% |
| Median household income | $60,000 | $83,000 | $80,000 |
Census LEHD 2023 · ACS
Reported crimes fell from 182 to 109 over the last three FBI years, a drop beyond ordinary year-to-year swings.
FBI crime data, 2025 · crimes reported to police
Expected storm and flood damage is higher than in 52% of U.S. communities.
FEMA National Risk Index · OpenFEMA
1 within 15 miles of the center of Olney
About 4 of every 100 Olney residents are enrolled in college, against 6 across Illinois.
4 places in Olney on the National Register of Historic Places.
18 notable people were born in Olney.


City in Illinois, United States
Olney ( AWL-nee) is a city in and the county seat of Richland County, Illinois, United States. As of the 2020 census, Olney had a population of 8,701.
From Wikipedia, licensed CC BY-SA 4.0 · facts via Wikidata (CC0)
Short answers, built from the data on this page.
Olney grades B− overall, better than 46% of U.S. towns and #498 of 767 in Illinois. It grades C for health, C+ for safety and B− for schools. Jobs & income is its weak spot, with a C−.
Not for the area. Cost of living, which also weighs rents, property taxes and how many households pay 30% or more of their income for housing, grades A−.
18 notable people were born here, including Elaine Shepard and Terry L. Bruce.