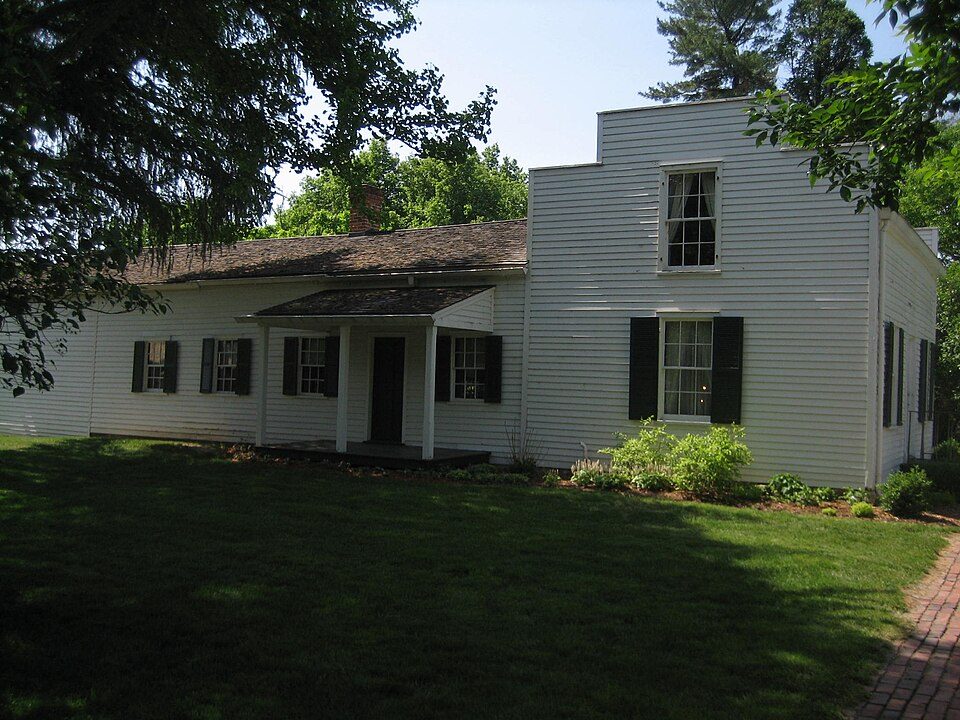
185 years in pictures
Census counts: 855 in 1880, 2,861 in 2020. The archive holds 14 old photos and papers going back to 2006 and 2 maps from 1922 on.
1 place on the National Register of Historic Places.
- 1841Mount Morris Township is settled

Each edition grades its towns against each other only.

Mount Morris Township grades B− overall, 453rd among Illinois's 767 graded towns, with clear strengths and some subjects that lag. It also does better than most on schools: its schools rank ahead of 74% of Illinois towns. Its lowest everyday mark is in health: residents are less healthy than 75% of U.S. towns on CDC estimates. A typical home there costs about $121K, 1.5 years of the Rochelle area’s $82K median household income. History is its standout character grade: an A, better than 94% of U.S. towns, with 1 place on the National Register. On history, just 67 of Illinois’ 1,285 towns do better. Mount Morris Township is more walkable than 69% of U.S. towns. Only 9 of the 768 Illinois towns we compare have a lower January low than Mount Morris Township.
Where Mount Morris Township beats most towns.
Where Mount Morris Township’s working residents go each day. Line width shows the share.
Census LEHD 2023
Each subject compared with towns across the country (schools within Illinois), ordered by how far Mount Morris Township is from typical.
How TownRatings grades towns →
Census counts: 855 in 1880, 2,861 in 2020. The archive holds 14 old photos and papers going back to 2006 and 2 maps from 1922 on.
1 place on the National Register of Historic Places.
Who provides power, water and the rest in Mount Morris Township, and how to reach them.
EPA SDWIS (Oct 9, 2026) · HIFLD + EIA-861 2025 · Census 2020 ZCTAs · NCES 2024–25 · registration: vote.gov, updated Sep 12, 2025.
Ordered by what stands out in Mount Morris Township.
Mount Morris Township carries less natural-hazard risk than nearly all of Illinois (mostly inland flooding), is healthier than towns with similar incomes and sends most of its workers to Rockford and beyond.
FEMA rates its natural-hazard risk lower than 97% of Illinois towns; that rating is what its B+ for hazard risk is built on.
FEMA puts 45% of Mount Morris Township’s expected hazard losses down to inland flooding, and 17% to tornadoes.
FEMA National Risk Index · OpenFEMA
Mount Morris Township has 246 jobs for its 1,348 working residents: even if every job went to a resident, most would still commute out. Jobs based here fell from 389 in 2013 to 246.
The middle household income in Mount Morris Township is $50,000. This Illinois town had 246 jobs in 2023, down 143 from 2013. Its typical journey to work stands at 21 minutes, below both the Illinois town median (26 minutes) and the median of U.S. towns (25 minutes). The share of residents in Mount Morris Township who live below the poverty line: 13%.
| Mount Morris Township | Illinois towns | U.S. towns | |
|---|---|---|---|
| Median household income | $50,000 | $83,000 | $80,000 |
| Average trip to work | 21 minutes | 26 minutes | 25 minutes |
| Below the poverty line | 13% | 8.4% | 9.6% |
| Working residents who work in town | 3.5% | 8.4% | 8% |
Census LEHD 2023 · ACS
Against the 5,615 U.S. towns with household incomes like Mount Morris Township’s, it is healthier than 59%, so that grade isn’t only a matter of income.
In Mount Morris Township, 14% of adults have diabetes, against 11% in Illinois’ towns and 12% across U.S. towns. Mount Morris Township: just over two in five adults have obesity. Against the Illinois average, Mount Morris Township comes out ahead on 1 CDC measures out of 32, and behind on 12.
| Mount Morris Township | Illinois towns | U.S. towns | |
|---|---|---|---|
| High blood pressure (CDC PLACES) | 41% | 35% | 35% |
| Frequent physical distress (CDC PLACES) | 16% | 13% | 14% |
| Obesity (CDC PLACES) | 42% | 37% | 35% |
| Diabetes (CDC PLACES) | 14% | 11% | 12% |
| What stands out | Mount Morris Township | IL |
|---|---|---|
| More adults treating high blood pressure | 79.7% | 75.7% |
| More older adults who have lost all their teeth | 21.2% | 10.3% |
CDC PLACES 2025 · modeled estimates for adults · CMS · HRSA
In July, afternoons reach 83°; in January, nights fall to 13°, and about 32 inches of snow falls in a winter.
NOAA U.S. Climate Normals, 1991–2020
1.0 miles of trail in 3 parks and preserves.
| Biggest places to walk | Trails | Acres |
|---|---|---|
| 1. Dillehay Park | 0.6 mi | 18 |
| 2. Zickur Park | — | 2 |
| 3. Hal Palmer Park | — | 1 |
Trails & parks © OpenStreetMap contributors · Conserved land: USGS PAD-US
Museums, parks, gardens and other places to visit around Mount Morris Township. Close and well known come first.
23 mi Stadium & arenaBMO Center
16 mi National Historic SiteRonald Reagan Boyhood Home National Historic Site
25 mi GardenAnderson Japanese Gardens
37 mi TheatreEgyptian Theatre, DeKalb
16 mi MuseumJohn Deere House and Shop
37 mi MuseumEllwood HouseBMO Center: SimLibrarian, CC0 · Ronald Reagan Boyhood Home National Historic Site: Teemu008 from Palatine, Illinois, CC BY-SA 2.0 · Anderson Japanese Gardens: M. Readey, CC BY-SA 3.0 · Egyptian Theatre, DeKalb: Andy McMurray, CC BY 2.5 · John Deere House and Shop: IvoShandor, CC BY 2.5 · Ellwood House: Paul R. Burley, CC0
None within 15 miles of Mount Morris Township; the nearest are
About 5 of every 100 Mount Morris Township residents are enrolled in college, about the same as Illinois.
Village in Illinois, United States
Mount Morris is a village in Mount Morris Township, Ogle County, Illinois, United States. As of the 2020 census, Mount Morris had a population of 2,861.
From Wikipedia, licensed CC BY-SA 4.0 · facts via Wikidata (CC0)
4 towns share a border with Mount Morris Township.
| Town | IL rank | Overall | Cost | Safety | Schools | Health |
|---|---|---|---|---|---|---|
| Mount Morris Township | #453 | B− | B | — | B+ | C |
| Pine Creek Township | — | — | — | — | — | — |
| Maryland Township | — | — | — | — | — | — |
| Lincoln Township | — | — | — | — | — | — |
| Rockvale Township | — | — | C+ | — | A− | B− |
Rockvale Township has fewer than 2,500 residents, so it gets subject grades but no overall grade. Mount Morris Township and Rockvale Township report no FBI crime data of their own. Pine Creek Township, Maryland Township and Lincoln Township aren’t graded (fewer than 1,000 residents, or not enough data). Compare Mount Morris Township with a neighbor →
Short answers, built from the data on this page.
Mount Morris Township grades B− overall, better than 54% of U.S. towns and #453 of 767 in Illinois. It grades C for health and B+ for schools.
Cost of living, which also weighs rents, property taxes and how many households pay 30% or more of their income for housing, grades B.