173 years in pictures
Census counts: 257 in 1890, 9,385 in 2020. The archive holds 4 old photos and papers going back to 2025 and 6 maps from 1929 on.
- 1853Manhattan is established
Each edition grades its towns against each other only.

A town of 10,943, established in 1853.
Because it does well by almost any measure. Manhattan earns an A+, 21st of 767 graded towns in Illinois. The median household earns $129K, crime is low: it reports less per resident than 95% of U.S. towns, and its schools outperform 89% of the state's. Its lowest mark, a C, is in cost of living. Manhattan’s average trip to work is 38 minutes, above both Illinois’ towns (26 minutes) and U.S. towns (25 minutes).
Where Manhattan beats most towns.
| Widest gap | Manhattan | IL |
|---|---|---|
| Fewer adults facing food insecurity | 9.2% | 15.9% |
7,051 counted in 2010 and 9,385 in 2020; an estimated 10,943 in 2025.
Growth hasn’t slowed: 16.6% since 2020, after 33.1% in the decade before.
U.S. Census 2010 & 2020 counts · Census Bureau estimate, July 1, 2025
Each subject compared with towns across the country (schools within Illinois), ordered by how far Manhattan is from typical.
How TownRatings grades towns →
Census counts: 257 in 1890, 9,385 in 2020. The archive holds 4 old photos and papers going back to 2025 and 6 maps from 1929 on.
Who provides power, water and the rest in Manhattan, and how to reach them.
EPA SDWIS (Oct 9, 2026) · HIFLD + EIA-861 2025 · Census 2020 ZCTAs · NCES 2024–25 · registration: vote.gov, updated Sep 12, 2025.
Ordered by what stands out in Manhattan.
Manhattan has less food insecurity than most of Illinois, sends most of its workers to Chicago and beyond and has household incomes well above the Illinois norm.
Violent crime is rare: 5 reported in 2025, 0.5 per 1,000 residents.
The property crime rate in Manhattan is 2.1 per 1,000 residents.
| Manhattan | Illinois towns | U.S. towns | |
|---|---|---|---|
| Property crimes per 1,000 (2025) | 2.1 per 1,000 residents | 7.9 | 9.9 |
| Violent crimes per 1,000 (2025) | 0.5 per 1,000 residents | 1 | 1.6 |
FBI crime data, 2025 · crimes reported to police
Its widest gap with Illinois is food insecurity: 9.2% of its 6,459 adults worry about having enough food, against 15.9% statewide. Against the 4,698 U.S. towns with household incomes like Manhattan’s, it is less healthy than 53%: its national edge comes with its incomes.
26% of adults have high blood pressure in Manhattan. Among 767 Illinois towns, just 3 have a lower share of adults who have diabetes than Manhattan. 23% of adults binge drink in Manhattan.
| Manhattan | Illinois towns | U.S. towns | |
|---|---|---|---|
| Binge drink (CDC PLACES) | 23% | 18% | 16% |
| High blood pressure (CDC PLACES) | 26% | 35% | 35% |
| Diabetes (CDC PLACES) | 7.5% | 11% | 12% |
| Frequent physical distress (CDC PLACES) | 11% | 13% | 14% |
| What stands out | Manhattan | IL |
|---|---|---|
| Fewer adults facing food insecurity | 9.2% | 15.9% |
| Fewer uninsured adults | 6.2% | 9.9% |
| More binge drinkers | 23.2% | 17.8% |
CDC PLACES 2025 · modeled estimates for adults · CMS · HRSA
The median property tax bill is $8,785, against $5,298 across Illinois, another input to its cost-of-living grade.
The typical Manhattan home is worth about $400,000, up 3.9% in a year, 35% above the Illinois typical home. 88% of Manhattan households own their home.
| Manhattan | Illinois towns | U.S. towns | |
|---|---|---|---|
| Households that own their home | 88% | 75% | 73% |
| Median rent | $1,213 a month | $1,128 a month | $1,185 a month |
Census ACS, 2020–24 · Zillow Home Value Index · Redfin Data Center
Manhattan has 986 jobs for its 5,068 working residents: even if every job went to a resident, most would still commute out. The average commute takes 37.5 minutes, against 27.8 across Illinois.
Most working residents leave Manhattan for work: only 5% work in town. Since 2013, Manhattan has lost 131 jobs, to 986 in 2023. The top destinations are Chicago (9%), Joliet (8%) and New Lenox (7%).
| Manhattan | Illinois towns | U.S. towns | |
|---|---|---|---|
| Median household income | $129,000 | $83,000 | $80,000 |
| Below the poverty line | 4.2% | 8.4% | 9.6% |
| Working residents who work in town | 4.8% | 8.4% | 8% |
Census LEHD 2023 · ACS
The median household earns $128,522, against $83,390 across Illinois, one input to its A+ for jobs and income.
Manhattan’s median age is 32.8 years. Manhattan has grown 17% since 2020, to 10,943 residents in the Census Bureau’s 2025 estimate. People 65 and older are 8% of residents (17% statewide); children under 18 are 31% of residents (22% statewide).
| Manhattan | Illinois towns | U.S. towns | |
|---|---|---|---|
| Under 18 | 31% | 22% | 22% |
| Aged 65 or older | 8.2% | 19% | 18% |
| Median age | 32.8 years | 40.7 years | 40.5 years |
| Bachelor’s degree or more, 25+ | 35% | 29% | 29% |
53% women, 47% men
That’s an even split within the survey’s margin of ±3.7 points. Across Illinois, 50.6% of residents are women. Median age: women 32.4, men 33.5.
| Manhattan | IL | U.S. | |
|---|---|---|---|
| Under 10 | 18.2% | 11.5% | 11.6% |
| 10 to 17 | 12.4% | 10.4% | 10.3% |
| 18 to 24 | 8.3% | 9.1% | 9.1% |
| 25 to 34 | 14.2% | 13.6% | 13.7% |
| 35 to 44 | 16.1% | 13.3% | 13.2% |
| 45 to 54 | 13.3% | 12.4% | 12.2% |
| 55 to 64 | 9.3% | 12.8% | 12.7% |
| 65 to 74 | 6% | 10% | 10.2% |
| 75 and older | 2.2% | 7% | 7% |
| No diploma | 1.3% | 9.5% | 10.4% |
| High school | 27.8% | 25.1% | 26% |
| Some college | 22.1% | 19.2% | 19.1% |
| Associate’s | 13.9% | 8.3% | 8.8% |
| Bachelor’s | 23.8% | 22.6% | 21.6% |
| Graduate | 11.2% | 15.3% | 14.1% |
Census population estimates, 2025 · U.S. Census Bureau · ACS 2020-2024 5-year estimates
Manhattan has chilly winters and warm summers. July afternoons reach 84°, January nights drop to 16° and about 17 inches of snow falls in a winter.
NOAA U.S. Climate Normals, 1991–2020
| Manhattan | Illinois towns | U.S. towns | |
|---|---|---|---|
| Miles of trail per square mile | 0.2 miles per square mile | 0.3 | 0.4 |
| Conserved land | 3.4% | 3.7% | 4.3% |
| Biggest places to walk | Trails | Acres |
|---|---|---|
| 1. Manhattan Central Park | 0.2 mi | 7 |
| 2. Gustafson Grove | — | 2 |
| 3. Leighlinbridge Park | — | 2 |
Trails & parks © OpenStreetMap contributors · Conserved land: USGS PAD-US
Expected storm and flood damage is lower than in 55% of U.S. communities. Since 1982, 2 flood insurance claims have been paid out in Manhattan.
FEMA flood insurance claims · FEMA National Risk Index · OpenFEMA
Museums, parks, gardens and other places to visit around Manhattan. Close and well known come first.
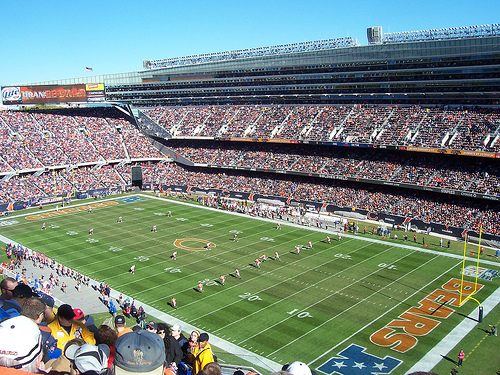
Big draw36 mi Stadium & arenaSoldier Field
Big draw33 mi MuseumBarack Obama Presidential Center
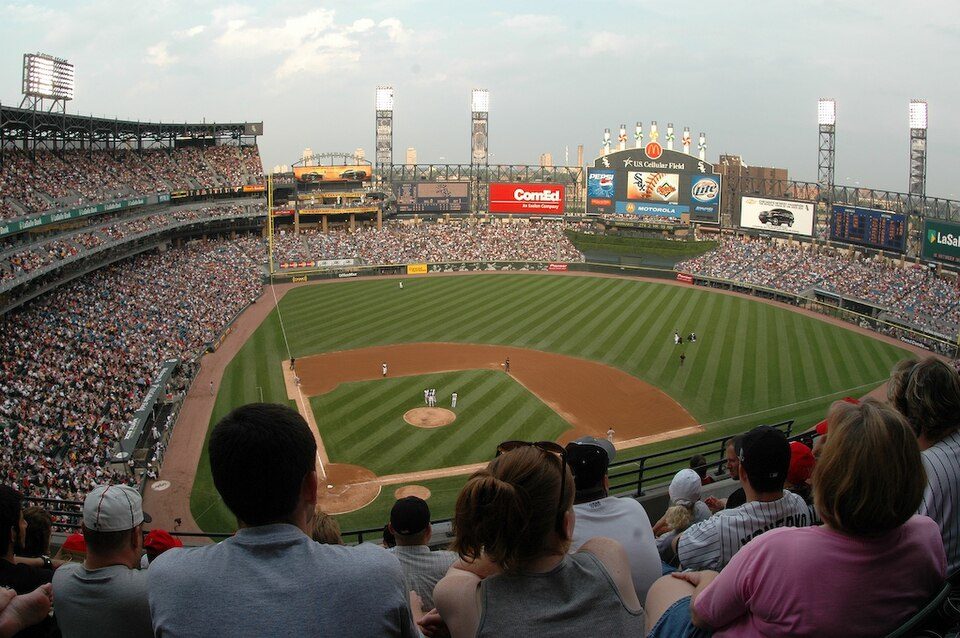
Big draw34 mi Stadium & arenaRate Field
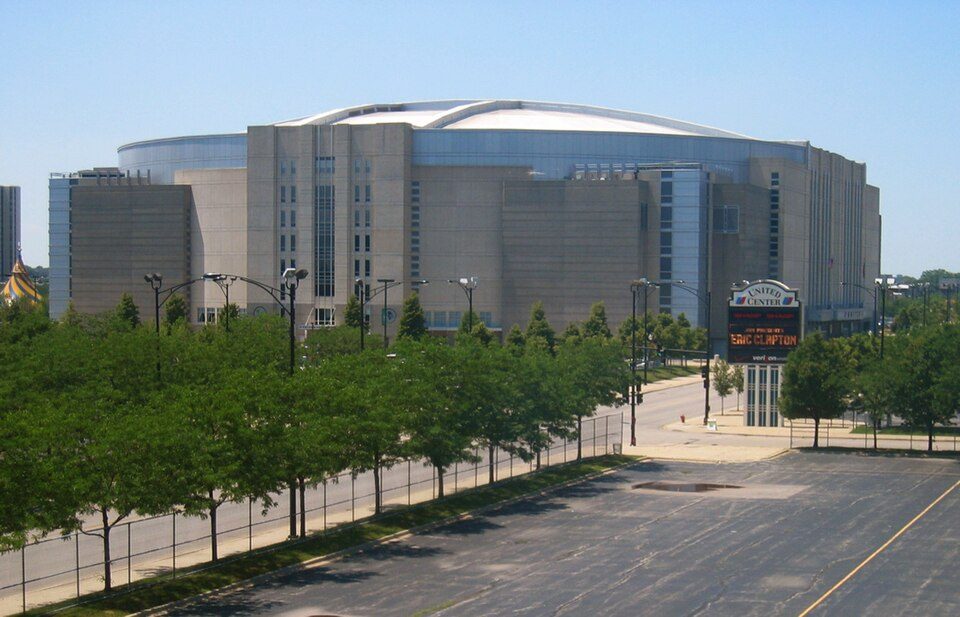
Big draw36 mi Stadium & arenaUnited Center
Big draw37 mi MuseumArt Institute of Chicago1.5M visitors a year
36 mi MuseumField Museum of Natural History1.4M visitors a yearSoldier Field: Photo by Joon Han Contact: [email protected], CC BY-SA 3.0 · Barack Obama Presidential Center: AlphaBeta135, CC0 · Rate Field: User Enoch Lai on en.wikipedia, CC BY-SA 3.0 · United Center: User:JeremyA, CC BY-SA 2.5 · Art Institute of Chicago: ajay_suresh, CC BY 2.0 · Field Museum of Natural History: Sea Cow, CC BY-SA 4.0
5 within 15 miles of the center of Manhattan
About 5 of every 100 Manhattan residents are enrolled in college, about the same as Illinois.
Where Manhattan’s working residents go each day. Line width shows the share.
Census LEHD 2023
Village in Illinois, United States
Manhattan (MANN-haton) is a village in Will County, Illinois. The population was 9,385 at the time of the 2020 census. The U.S. Census Bureau estimates the population to be 10,772 as of July 2024. The community is located in northeastern Illinois approximately 50 miles (80 km) southwest of Chicago.
From Wikipedia, licensed CC BY-SA 4.0 · facts via Wikidata (CC0)
Short answers, built from the data on this page.
Yes, by almost any measure. Manhattan grades A+ overall, better than 98% of U.S. towns and #21 of 767 in Illinois. It grades A− for health, A+ for safety and A for schools.
That is 4.4 years of the area's median household income ($90,887 across the Chicago-Naperville-Elgin, IL-IN metro area). Cost of living, which also weighs rents, property taxes and how many households pay 30% or more of their income for housing, grades C.