LindenhurstIL
A town of 14,810, settled in 1953.
Is Lindenhurst a good place to live?
For most people who can afford it, yes. Lindenhurst grades A overall, 143rd of 767 graded towns in Illinois. It reports less crime per resident than 94% of U.S. towns. CDC estimates put its residents' health ahead of 92% of the country and the median household earns $131K. What holds it back is price: homes are expensive, about $360K for a typical one and 4 times the Chicago metro’s $91K median household income. 15% of the land in Lindenhurst is conserved, against 3.6% in Illinois’ towns and 4.3% across U.S. towns. On history, just 13 of Illinois’ 1,285 towns do worse. The biggest park or preserve is Fourth Lake Forest Preserve, at 109 acres.
What makes Lindenhurst stand out
Where Lindenhurst beats most towns.
Violent crime per 1,000 residents
| Widest gap | Lindenhurst | IL |
|---|---|---|
| Fewer adults facing food insecurity | 9.2% | 15.9% |
3 miles of trails in Lindenhurst
15% of the town is conserved land, across 17 parks and preserves.
How Lindenhurst grades
Each subject compared with towns across the country (schools within Illinois), ordered by how far Lindenhurst is from typical.
How TownRatings grades towns →
Six Flags Great America and 62 more within 40 miles
Museums, parks, gardens and other places to visit around Lindenhurst. Close and well known come first.
 Big draw6 mi Theme parkSix Flags Great America3.0M visitors a year
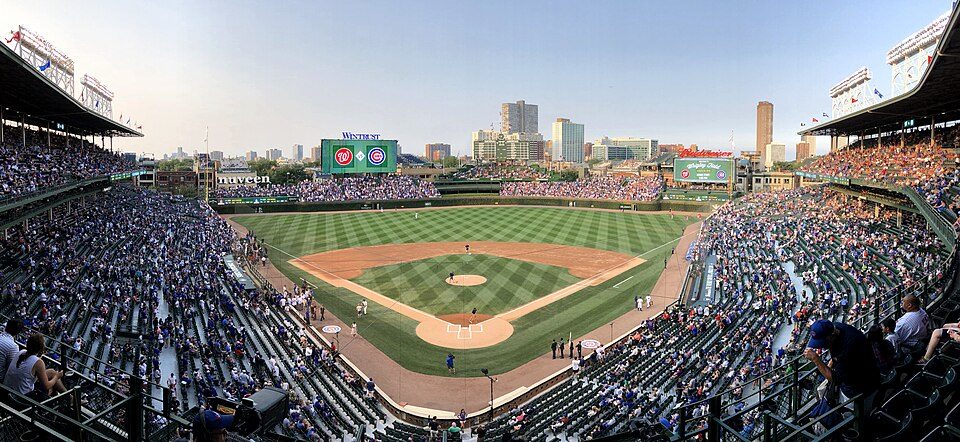 Big draw38 mi Stadium & arenaWrigley Field
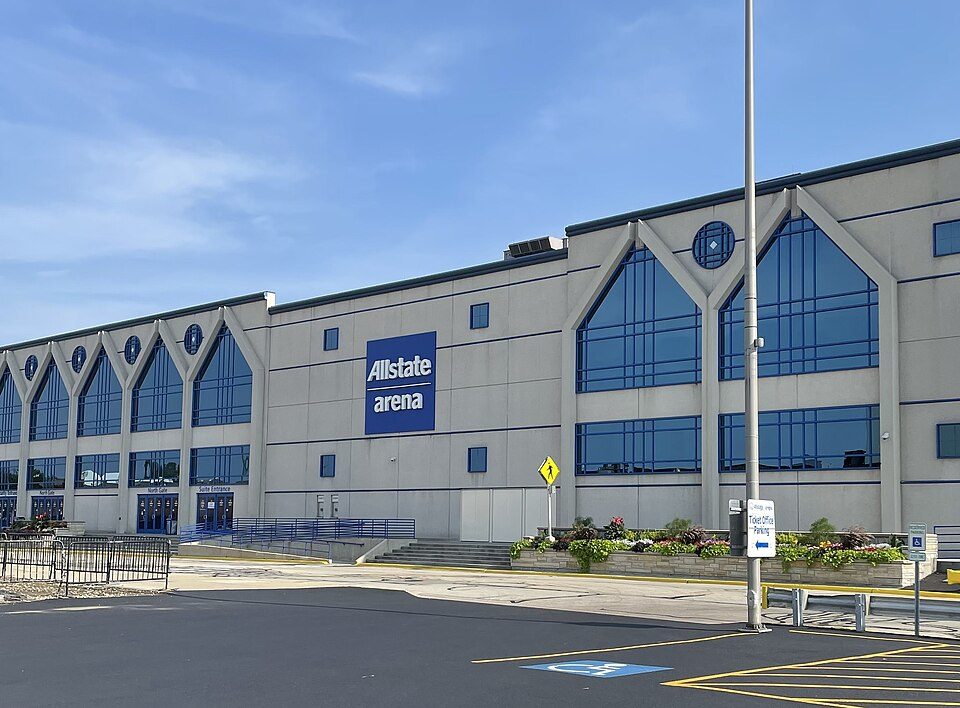 29 mi Stadium & arenaAllstate Arena
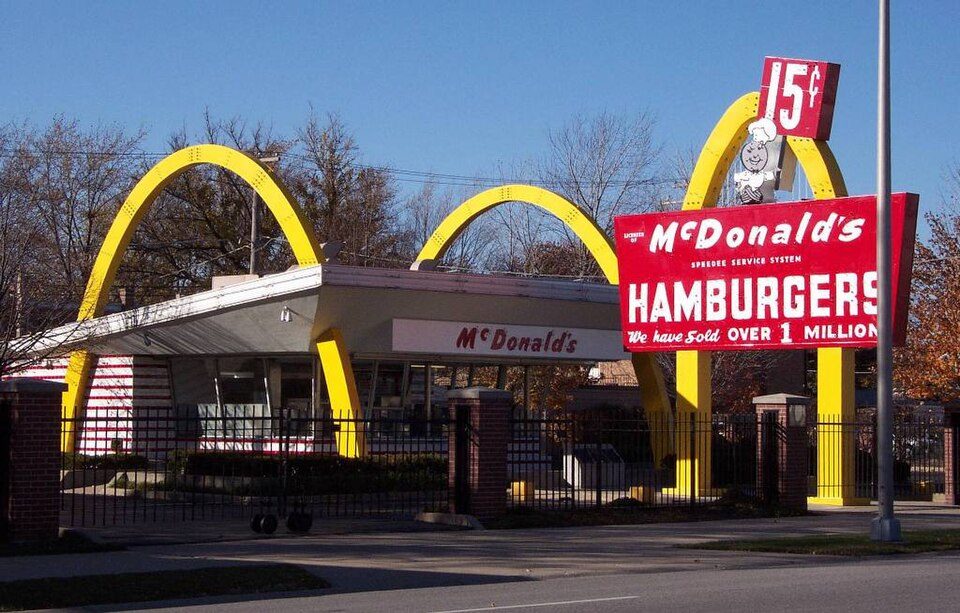 27 mi MuseumMcDonald's #1 Store Museum
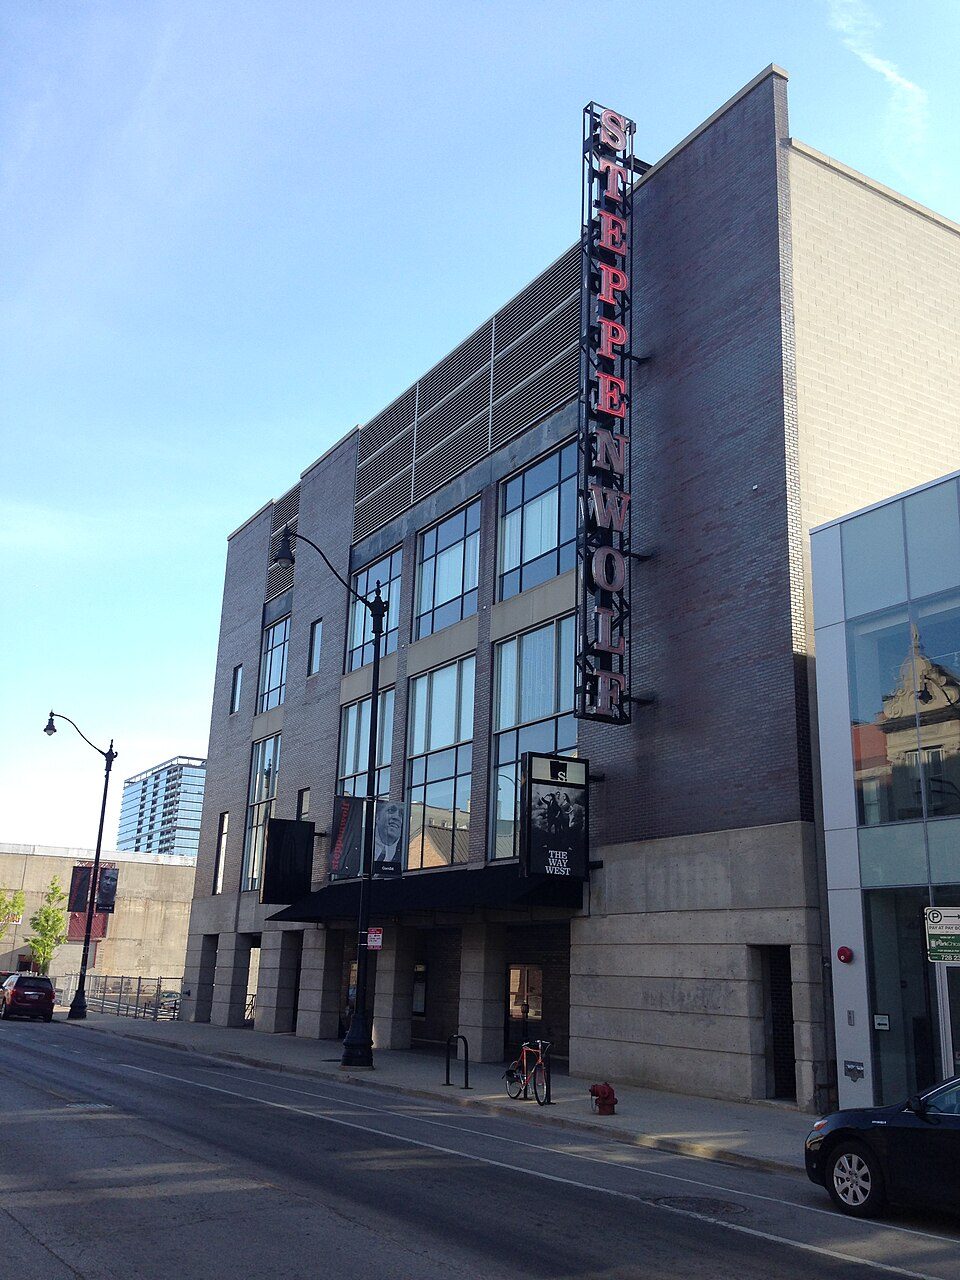 40 mi TheatreSteppenwolf Theatre Company
 39 mi Park & preserveLincoln Park
Photo credits
Six Flags Great America: Feather Better, CC BY 4.0 · Wrigley Field: Ryan Dickey, CC BY 2.0 · Allstate Arena: Nkon21, CC BY-SA 4.0 · McDonald's #1 Store Museum: Bruce Marlin, CC BY-SA 2.5 · Steppenwolf Theatre Company: victorgrigas, CC BY-SA 3.0 · Lincoln Park: Krzysztof Ziarnek, Kenraiz, CC BY-SA 4.0


Moving to Lindenhurst: who provides what
Who provides power, water and the rest in Lindenhurst, and how to reach them.
EPA SDWIS (Oct 9, 2026) · HIFLD + EIA-861 2025 · Census 2020 ZCTAs · NCES 2024–25 · registration: vote.gov, updated Sep 12, 2025.
The data
Ordered by what stands out in Lindenhurst.
Lindenhurst has less food insecurity than most of Illinois, sends most of its workers to Chicago and beyond and has household incomes well above the Illinois norm.
For safety, Lindenhurst earns an A
Violent crime is rare: 8 reported in 2025, 0.5 per 1,000 residents.
Lindenhurst’s violent offense rate is 0.5 per 1,000 residents. The rate of thefts and burglaries for Lindenhurst comes to 1.8 per 1,000 residents, where Illinois’ towns sit at 7.9 and U.S. towns at 9.9.
| Lindenhurst | Illinois towns | U.S. towns | |
|---|---|---|---|
| Property crimes per 1,000 (2025) | 1.8 per 1,000 residents | 7.9 | 9.9 |
| Violent crimes per 1,000 (2025) | 0.5 per 1,000 residents | 1 | 1.6 |
Violent crime per 1,000 residents
Property crime per 1,000 residents
FBI crime data, 2025 · crimes reported to police
For health, Lindenhurst earns an A
Its widest gap with Illinois is food insecurity: 9.2% of its 10,812 adults worry about having enough food, against 15.9% statewide. Against the 4,392 U.S. towns with household incomes like Lindenhurst’s, it is healthier than 76%, a smaller edge than it has nationally: part of it comes with its incomes.
Among adults 18 to 64 in Lindenhurst, 6.3% have no health insurance. Two figures for adults locally: 11% report frequent physical distress, 14% say their health is fair or poor.
| Lindenhurst | Illinois towns | U.S. towns | |
|---|---|---|---|
| Get no exercise (CDC PLACES) | 17% | 23% | 25% |
| Frequent physical distress (CDC PLACES) | 11% | 13% | 14% |
| Fair or poor health (CDC PLACES) | 14% | 18% | 19% |
| Sleep under 7 hours (CDC PLACES) | 32% | 35% | 36% |
| What stands out | Lindenhurst | IL |
|---|---|---|
| Fewer adults facing food insecurity | 9.2% | 15.9% |
| Fewer uninsured adults | 6.3% | 9.9% |
CDC PLACES 2025 · modeled estimates for adults · CMS · HRSA
For the outdoors, Lindenhurst earns an A
Lindenhurst’s density of trails stands at 0.6 miles per square mile. Count the trails in 17 parks and preserves and they come to 3.0 miles.
| Biggest places to walk | Trails | Acres |
|---|---|---|
| 1. Engle Memorial Park | 0.6 mi | 16 |
| 2. John Janega Memorial Park | 0.6 mi | 13 |
| 3. Bonner Heritage Farm | 0.3 mi | 7 |
Trails & parks © OpenStreetMap contributors · Conserved land: USGS PAD-US
Most of Lindenhurst’s workers leave town for work
Lindenhurst has 1,084 jobs for its 7,153 working residents: even if every job went to a resident, most would still commute out.
Lindenhurst: 4.1% of residents live below the poverty line. For most workers, Lindenhurst is a place to come home to: only 3% work in town. Its typical journey to work is 34 minutes. The top destinations are Chicago (9%), Waukegan (5%) and Gurnee (5%).
| Lindenhurst | Illinois towns | U.S. towns | |
|---|---|---|---|
| Average trip to work | 34 minutes | 26 minutes | 25 minutes |
| Median household income | $131,000 | $83,000 | $80,000 |
| Work from home | 18% | 11% | 11% |
| Below the poverty line | 4.1% | 8.4% | 9.6% |
Where working residents work
Census LEHD 2023 · ACS
Lindenhurst faces a low natural-hazard risk, led by inland flooding
The national flood insurance program has paid 10 claims in Lindenhurst since 1979. Compared with 72% of U.S. communities, expected storm and flood damage locally is lower. FEMA puts 52% of the town’s expected hazard losses down to inland flooding, and 20% to cold waves. Federal disaster aid has reached households in Lindenhurst after 2 declared disasters, most recently in 2013.
FEMA flood insurance claims · FEMA disaster declarations and aid · FEMA National Risk Index · OpenFEMA
For cost of living, Lindenhurst earns a C−
The median property tax bill is $9,402, against $5,298 across Illinois, another input to its cost-of-living grade.
Lindenhurst’s typical rent comes in at $1,768 a month. Typical home values rose 4.9% in the year to September 2026. 86% of households are owner-occupiers in the town.
| Lindenhurst | Illinois towns | U.S. towns | |
|---|---|---|---|
| Median rent | $1,768 a month | $1,128 a month | $1,185 a month |
| Households that own their home | 86% | 75% | 73% |
Typical home value
Census ACS, 2020–24 · Zillow Home Value Index · Redfin Data Center
The climate in Lindenhurst brings snowy winters and pleasant summers
In Lindenhurst, the typical July afternoon high is 83°F.
Typical low → high °F
NOAA U.S. Climate Normals, 1991–2020
Lindenhurst is younger than the Illinois average
The median household earns $131,474, against $83,390 across Illinois, one input to its A− for jobs and income.
The share of residents in Lindenhurst who are under 18: 24%. People 65 and older are 13% of residents (17% statewide). 48% of adults 25 and older have a bachelor’s degree or more, vs 38% across Illinois. The town has grown 2.8% since 2020, to 14,810 residents in the Census Bureau’s 2025 estimate.
| Lindenhurst | Illinois towns | U.S. towns | |
|---|---|---|---|
| Bachelor’s degree or more, 25+ | 48% | 29% | 29% |
| Aged 65 or older | 13% | 19% | 18% |
| Median age | 37.6 years | 40.7 years | 40.5 years |
| Under 18 | 24% | 22% | 22% |
Ages · share of residents
Education · adults 25 and older
Women and men · all residents
50% women, 50% men
That’s an even split within the survey’s margin of ±2.3 points. Across Illinois, 50.6% of residents are women. Median age: women 37.3, men 38.0.
| Lindenhurst | IL | U.S. | |
|---|---|---|---|
| Under 10 | 13.6% | 11.5% | 11.6% |
| 10 to 17 | 10.8% | 10.4% | 10.3% |
| 18 to 24 | 9.3% | 9.1% | 9.1% |
| 25 to 34 | 12.5% | 13.6% | 13.7% |
| 35 to 44 | 14.9% | 13.3% | 13.2% |
| 45 to 54 | 14.8% | 12.4% | 12.2% |
| 55 to 64 | 11.7% | 12.8% | 12.7% |
| 65 to 74 | 7.8% | 10% | 10.2% |
| 75 and older | 4.7% | 7% | 7% |
| No diploma | 4.1% | 9.5% | 10.4% |
| High school | 17.3% | 25.1% | 26% |
| Some college | 22.3% | 19.2% | 19.1% |
| Associate’s | 8.4% | 8.3% | 8.8% |
| Bachelor’s | 33% | 22.6% | 21.6% |
| Graduate | 14.9% | 15.3% | 14.1% |
Census population estimates, 2025 · U.S. Census Bureau · ACS 2020-2024 5-year estimates
Everything we know about Lindenhurst
Colleges nearby
3 within 15 miles of the center of Lindenhurst
About 7 of every 100 Lindenhurst residents are enrolled in college, about the same as Illinois.
97% of working residents leave Lindenhurst for work
Where Lindenhurst’s working residents go each day. Line width shows the share.
Census LEHD 2023
About Lindenhurst
Village in Illinois, United States
Lindenhurst is a village in Lake County, Illinois, United States. Per the 2020 census, the population was 14,406. Lindenhurst lies within Lake Villa Township.
From Wikipedia, licensed CC BY-SA 4.0 · facts via Wikidata (CC0)
- Established
- 1953
- Area
- 4.9 sq mi
Lindenhurst’s neighbors
7 towns share a border with Lindenhurst.
| Town | IL rank | Overall | Cost | Safety | Schools | Health |
|---|---|---|---|---|---|---|
| Lindenhurst | #143 | A | C− | A | B+ | A |
| Venetian Village | — | — | C | — | B+ | A− |
| Old Mill Creek | — | — | — | — | — | — |
| Lake Villa | #151 | A | C+ | A− | B+ | A− |
| Newport Township | #443 | B | C− | — | B | B+ |
| Grayslake | #52 | A+ | C+ | A− | B+ | A |
| Grandwood Park | #316 | B+ | D | — | B+ | A+ |
| Warren Township | #362 | B+ | C− | — | B− | A |
Venetian Village has fewer than 2,500 residents, so it gets subject grades but no overall grade. Venetian Village, Newport Township, Grandwood Park and Warren Township report no FBI crime data of their own. Old Mill Creek isn’t graded (fewer than 1,000 residents, or not enough data). Compare Lindenhurst with a neighbor →
Questions about Lindenhurst
Short answers, built from the data on this page.
Is Lindenhurst, IL a good place to live?
For most people who can afford it, yes. Lindenhurst grades A overall, better than 88% of U.S. towns and #143 of 767 in Illinois. It grades A for health, A for safety and B+ for schools. Cost of living is its weak spot, with a C−.
Is Lindenhurst, IL expensive?
Yes. Cost of living, which also weighs rents, property taxes and how many households pay 30% or more of their income for housing, grades C−.