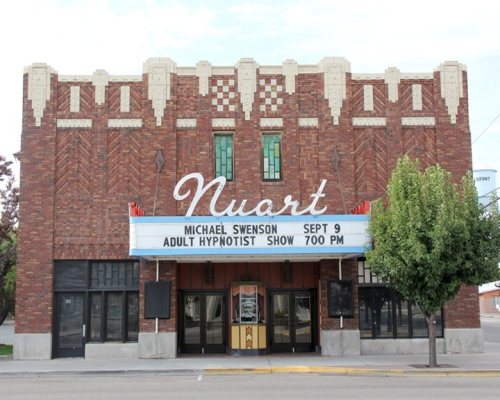
147 years in pictures
Census counts: 285 in 1880, 12,346 in 2020. The archive holds 5 old photos and papers going back to 1905 and 2 maps from 1940 on.
13 places on the National Register of Historic Places.
- 1879Blackfoot is settled
Each edition grades its towns against each other only.

Blackfoot gives you more for your money than most places: a typical home costs about $372K, 4.8 years of the Blackfoot area’s $78K median household income. It grades C overall, 44th among Idaho's 58 graded towns. On the plus side, it is more walkable than 80% of U.S. towns. Blackfoot has 13 places on the National Register of Historic Places, among them Blackfoot LDS Tabernacle and Blackfoot I.O.O.F. Hall. 30% of working residents work locally in Blackfoot, where Idaho’s towns sit at 20% and U.S. towns at 8%. The biggest park or preserve is Airport Park, at 22 acres.
Where Blackfoot beats most towns.
Census counts: 285 in 1880, 12,346 in 2020. The archive holds 5 old photos and papers going back to 1905 and 2 maps from 1940 on.
13 places on the National Register of Historic Places.
Each subject compared with towns across the country (schools within Idaho), ordered by how far Blackfoot is from typical.
How TownRatings grades towns →
Who provides power, water and the rest in Blackfoot, and how to reach them.
EPA SDWIS (Oct 9, 2026) · HIFLD + EIA-861 2025 · Census 2020 ZCTAs · NCES 2024–25 · registration: vote.gov, updated Sep 12, 2025.
Ordered by what stands out in Blackfoot.
Blackfoot trades lower home prices for longer drives to work, is healthier than towns with similar incomes and is safe by national standards but not by Idaho’s.
Homes are within reach (about $372K for the typical one, B+ for cost of living), but half of working residents commute more than 20 miles.
On the market in Blackfoot: a median 66 days to sell. The typical home value in the town is about $372,000, up 3.3% in a year, 22% below the Idaho typical home. The median rent here is $839 a month.
| Blackfoot | Idaho towns | U.S. towns | |
|---|---|---|---|
| Median rent | $839 a month | $1,125 a month | $1,185 a month |
| Households that own their home | 70% | 69% | 73% |
Census ACS, 2020–24 · Zillow Home Value Index · Redfin Data Center
Its public schools are run by the Blackfoot District. Two of its 10 schools are shown below, with the reason for each. The largest public high school is Blackfoot High School, with 1,170 students.
| School | Level | Students | Letter |
|---|---|---|---|
| Mountain View Middle SchoolLargest public middle schoolGrades 6–8 | Grades 6–8 | 526 | C |
| Blackfoot High SchoolLargest public high schoolGrades 9–12 | Grades 9–12 | 1,170 | C |
NCES · EDFacts · graded within ID on state tests and graduation
In July, afternoons reach 88°; in January, nights fall to 16°, and about 15 inches of snow falls in a winter.
NOAA U.S. Climate Normals, 1991–2020
Against the 9,745 U.S. towns with household incomes like Blackfoot’s, it is healthier than 53%, so its C+ isn’t only a matter of income.
14% of Blackfoot adults 18 to 64 have no health insurance. Blackfoot: 15% of adults report frequent physical distress.
| Blackfoot | Idaho towns | U.S. towns | |
|---|---|---|---|
| Obesity (CDC PLACES) | 40% | 32% | 35% |
| No health insurance, 18–64 (CDC PLACES) | 14% | 11% | 8.1% |
| Binge drink (CDC PLACES) | 14% | 15% | 16% |
| Food insecurity (CDC PLACES) | 18% | 13% | 14% |
| What stands out | Blackfoot | ID |
|---|---|---|
| More adults facing food insecurity | 18.4% | 12.8% |
| More adults facing a utility shut-off | 9.2% | 6.6% |
| More adults facing housing insecurity | 14.1% | 10.3% |
CDC PLACES 2025 · modeled estimates for adults · CMS · HRSA
Blackfoot has about as many jobs (5,585) as working residents, but only 1,636 people both live and work here. Jobs based here grew from 4,190 in 2013 to 5,585.
4.5% of workers do their job from home in Blackfoot. Employers in Blackfoot added 1,395 jobs between 2013 and 2023, to 5,585. The town’s typical journey to work comes in at 22 minutes. The top destinations are Idaho Falls (17%), Pocatello (9%) and Boise City (3%).
| Blackfoot | Idaho towns | U.S. towns | |
|---|---|---|---|
| Work from home | 4.5% | 10% | 11% |
| Average trip to work | 22 minutes | 20 minutes | 25 minutes |
| Median household income | $64,000 | $69,000 | $80,000 |
Census LEHD 2023 · ACS
At 21.4 crimes per 1,000 residents a year, it reports more crime than 77% of Idaho’s graded towns.
In Blackfoot, the rate of reported violence is 3 per 1,000 residents. Its property crime rate stands at 7.1 per 1,000 residents.
| Blackfoot | Idaho towns | U.S. towns | |
|---|---|---|---|
| Violent crimes per 1,000 (2025) | 3 per 1,000 residents | 2 | 1.6 |
| Property crimes per 1,000 (2025) | 7.1 per 1,000 residents | 6.3 | 9.9 |
FBI crime data, 2025 · crimes reported to police
No age group stands out against Idaho: all are within 4 points. In Blackfoot, the median age is 34.7 years. Population is up 7.7% here since 2020, to 13,361 by the Census Bureau’s 2025 estimate. The share of residents in Blackfoot who are under 18: 27%.
| Blackfoot | Idaho towns | U.S. towns | |
|---|---|---|---|
| Under 18 | 27% | 25% | 22% |
| Median age | 34.7 years | 35.2 years | 40.5 years |
| Aged 65 or older | 17% | 16% | 18% |
| Bachelor’s degree or more, 25+ | 25% | 25% | 29% |
53% women, 47% men
About 88 men for every 100 women (the survey’s margin: ±2.2 points). Across Idaho, 49.7% of residents are women.
| Blackfoot | ID | U.S. | |
|---|---|---|---|
| Under 10 | 13.3% | 12.5% | 11.6% |
| 10 to 17 | 13.9% | 11.6% | 10.3% |
| 18 to 24 | 9% | 9.8% | 9.1% |
| 25 to 34 | 14.2% | 13% | 13.7% |
| 35 to 44 | 11.4% | 13.1% | 13.2% |
| 45 to 54 | 9.1% | 11.3% | 12.2% |
| 55 to 64 | 12.5% | 11.7% | 12.7% |
| 65 to 74 | 9.5% | 10.4% | 10.2% |
| 75 and older | 7% | 6.6% | 7% |
| No diploma | 10.6% | 8.1% | 10.4% |
| High school | 35.1% | 26.1% | 26% |
| Some college | 21.6% | 24.2% | 19.1% |
| Associate’s | 8% | 9.7% | 8.8% |
| Bachelor’s | 16.6% | 21.3% | 21.6% |
| Graduate | 8.2% | 10.5% | 14.1% |
Census population estimates, 2025 · U.S. Census Bureau · ACS 2020-2024 5-year estimates
2.5 miles of trail in 4 parks and preserves. For Blackfoot, the trail network density is 0.4 miles per square mile. Parks and preserves here: 4, covering 40 acres.
| Blackfoot | Idaho towns | U.S. towns | |
|---|---|---|---|
| Conserved land | 6.1% | 2% | 4.3% |
| Miles of trail per square mile | 0.4 miles per square mile | 0.8 | 0.4 |
| Biggest places to walk | Trails | Acres |
|---|---|---|
| 1. Airport Park | — | 22 |
| 2. Jensen Grove Park | — | 15 |
| 3. Courthouse Square | — | 2 |
Trails & parks © OpenStreetMap contributors · Conserved land: USGS PAD-US
On expected storm and flood damage, Blackfoot sits above 56% of U.S. communities. FEMA puts 37% of the town’s expected hazard losses down to earthquakes, and 35% to inland flooding. Since 1979, 3 flood insurance claims have been paid out here.
FEMA flood insurance claims · FEMA National Risk Index · OpenFEMA
None within 15 miles of Blackfoot; the nearest are
About 4 of every 100 Blackfoot residents are enrolled in college, against 6 across Idaho.
13 places in Blackfoot on the National Register of Historic Places.
City in Idaho, United States
Blackfoot is a city in and the county seat of Bingham County, Idaho, United States. The population was 12,346 at the 2020 census. Blackfoot is the principal city of the Blackfoot, Idaho, Micropolitan Statistical Area, which includes Bingham County.
From Wikipedia, licensed CC BY-SA 4.0 · facts via Wikidata (CC0)
Short answers, built from the data on this page.
Blackfoot grades C overall, better than 32% of U.S. towns and #44 of 58 in Idaho. It grades C+ for health, C+ for safety and C+ for schools.
Idaho has less crime than most states, so among its own towns Blackfoot sits nearer the middle.