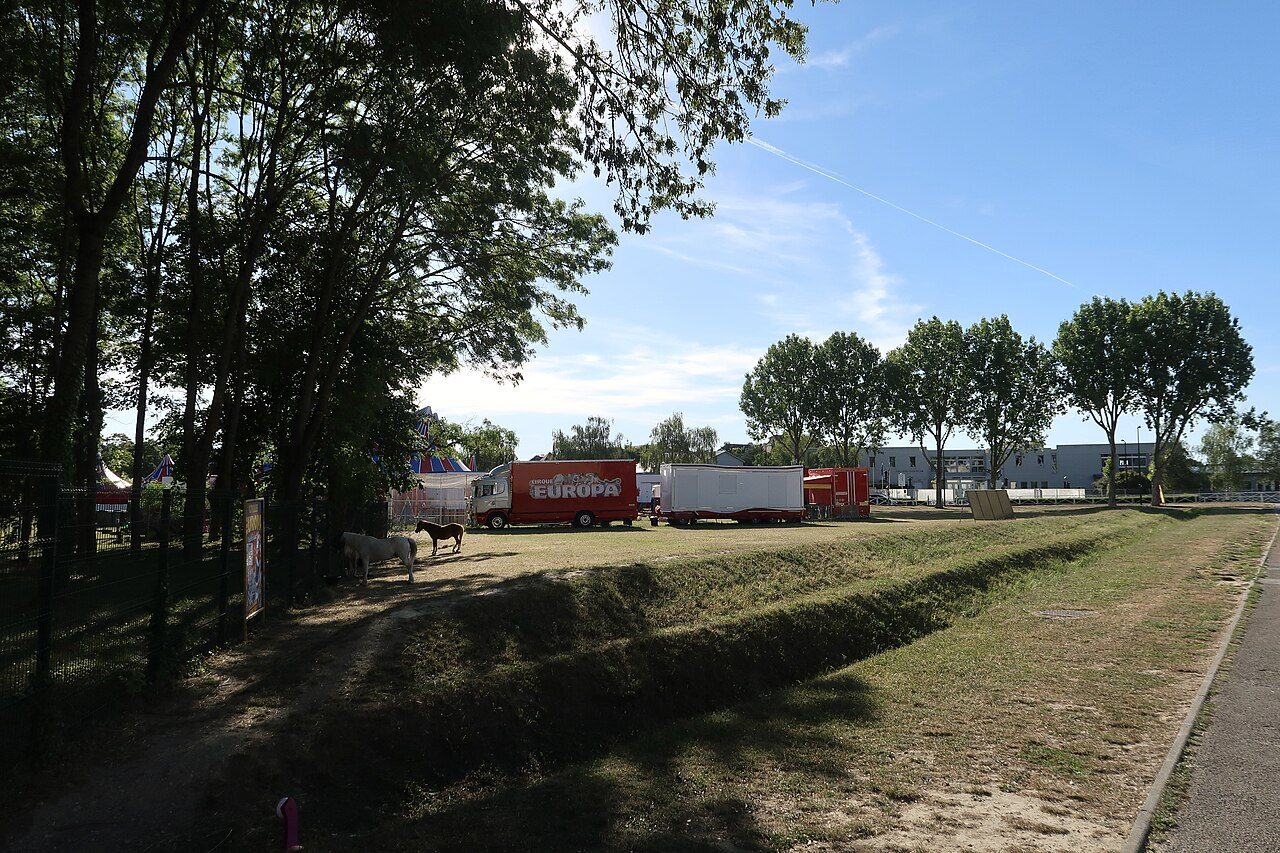
 Photo: Polymagou · CC BY-SA 4.0
Compared with the 664 compared French towns closest in size, Villepreux has less crime per resident than 94% of them
Per resident, the graded crimes were up 5% from 2023 to 2025. By contrast, it has less violent crime than 66% of compared French towns, and less burglary, vehicle theft and damage than 76%. For every 1,000 residents, 5.5 violent crimes and 10.3 incidents of burglary, vehicle theft and damage were logged a year.
Offenses recorded per 1,000 residents a year, 2023–2025 average (INSEE population of each year). Violence, and burglaries, vehicle thefts, thefts from vehicles and criminal damage, count equally.
What stands out about safety in Villepreux
Vehicle theft fell sharply
Police and gendarmerie recorded 34 cases of vehicle theft in Villepreux in 2023 and 14 in 2025. Small counts swing from year to year; the grade averages the three years. Year by year ↓
Among towns its size
Among the 664 French towns of 8,400 to 16,100 people with a Safety Grade, Villepreux is 43rd from the lowest recorded rate per resident. Towns its size ↓
Written from the SSMSI and INSEE data on this page. Figures are offenses police and gendarmerie recorded, not convictions.
The grade: A− for Villepreux
A fairly firm grade. Built on 564 offenses recorded in the graded categories over three years; with a town of 11,931, a few cases more or fewer would move it between B+ and A−.
Hidden counts: for armed robbery, this figure isn’t published when it’s small (five or fewer in at least one of the last three years); the index uses the département’s average instead, 0.6% of the index here. What isn’t published ↓
Per resident, against the 4,295 compared French towns with a Safety Grade.
Among 664 towns its size, Villepreux ranks 43rd for the least graded crime
| # | Town | People | Violence | Homes, vehicles | Safety |
|---|---|---|---|---|---|
| 1 | Grand-Santi French Guiana | 9,668 | 4.9 | 1.6 | A+ |
| … | |||||
| 40 | Veauche Loire | 8,975 | 4 | 11.5 | A− |
| 41 | Saint-Esprit Martinique | 10,322 | 9.8 | 5.9 | A− |
| 42 | Treillières Loire-Atlantique | 10,600 | 4.9 | 10.8 | A− |
| 43 | Villepreux Yvelines | 11,931 | 5.5 | 10.3 | A− |
| 44 | Urrugne Pyrénées-Atlantiques | 10,661 | 2.7 | 13.2 | A− |
| 45 | Souleuvre en Bocage Calvados | 8,629 | 9.6 | 6.3 | A− |
| 46 | Ballan-Miré Indre-et-Loire | 8,477 | 5.6 | 10.4 | A− |
| … | |||||
| 50 | Croissy-sur-Seine Yvelines | 11,013 | 3.6 | 12.5 | A− |
| 51 | Le Pecq Yvelines | 16,059 | 4.6 | 11.5 | A− |
| … | |||||
| 56 | Voisins-le-Bretonneux Yvelines | 10,624 | 4.3 | 12.3 | B+ |
| … | |||||
| 67 | Carrières-sur-Seine Yvelines | 14,791 | 5 | 11.8 | B+ |
| … | |||||
| 664 | Paris 1er Paris | 15,114 | 45.5 | 67.1 | D− |
Per 1,000 residents a year. Context only: the grade compares Villepreux with every compared French town, not just towns its size.
Lowest rate in the graded categories first, 2023–2025 average, with the closest to Villepreux and up to four from Yvelines.
What police and gendarmerie recorded most in 2025
Well above the median of towns its size: theft of vehicle parts (2.3 per 1,000 against 1.3). Not published for 2025: armed robbery, robbery without a weapon and drug dealing.
Theft without violence, robbery without a weapon, theft of vehicle parts, fraud and drug offenses are shown for information but left out of the Safety Grade, which counts violence plus burglaries, vehicle thefts, thefts from vehicles and criminal damage per resident.
Per 1,000 residents in 2025; the tick is the median of the graded French towns of 10,000 to 50,000.
Crime in Villepreux per 1,000 residents
Each dot is one resident’s share: offenses are counted, not victims, and one person can be the victim of several.
And 10 burglaries, vehicle thefts, thefts from vehicles and acts of criminal damage, and 10 thefts without violence and frauds: a year, 2023–2025 average.
Villepreux, year by year
Violence · per 1,000 residents
Burglary, vehicle theft, damage · per 1,000 residents
| Kind | In the grade | 2023 | 2024 | 2025 |
|---|---|---|---|---|
| Family violence | Violence | 40 | 31 | 38 |
| Other physical violence | Violence | 17 | 20 | 17 |
| Sexual violence | Violence | 10 | 9 | 12 |
| Armed robbery | Violence | n.p. | n.p. | n.p. |
| Burglary | Burglary, vehicle theft, damage | 27 | 21 | 28 |
| Vehicle theft | Burglary, vehicle theft, damage | 34 | 19 | 14 |
| Theft from vehicles | Burglary, vehicle theft, damage | 16 | 13 | 5 |
| Criminal damage | Burglary, vehicle theft, damage | 51 | 51 | 91 |
| Theft without violence | Not in the grade | 43 | 50 | 41 |
| Robbery without a weapon | Not in the grade | n.p. | n.p. | n.p. |
| Theft of vehicle parts | Not in the grade | 23 | 31 | 27 |
| Fraud | Not in the grade | 67 | 78 | 67 |
| Drug use | Not in the grade | 45 | 27 | 40 |
| Drug dealing | Not in the grade | n.p. | n.p. | n.p. |
Counts mix units, as SSMSI publishes them: victims for violence, offenses for burglary and damage, vehicles for vehicle theft. That’s why the page never adds them into one “total crimes”.
Offenses recorded each year. n.p.: not published (small: five or fewer in at least one of the last three years).
Villepreux and the towns around it
| Town | People | Violence | Homes, vehicles | Safety |
|---|---|---|---|---|
| Villepreux | 11,931 | 5.5 | 10.3 | A− |
| Les Clayes-sous-Bois | 16,804 | 7.2 | 12.4 | B |
| Bois-d'Arcy | 16,586 | 8.4 | 13.9 | B− |
| Plaisir | 31,811 | 9.8 | 14.7 | C+ |
| Saint-Nom-la-Bretèche | 4,965 | 2.4 | 14.6 | B+ |
| Fontenay-le-Fleury | 13,680 | 6.9 | 10.8 | B+ |
| Noisy-le-Roi | 7,713 | 4.7 | 15.1 | B |
Villepreux’s recorded rate in the graded categories is lower than each of its 6 graded neighbors’.
The nearest towns of 2,500 or more, per 1,000 residents a year, 2023–2025 average.
What this data can and can’t tell you
- Where offenses happen, not where victims live. SSMSI counts each offense in the commune where police or gendarmerie recorded it happening. Towns with shops, stations, a hospital or nightlife record more per resident, and visitors are part of that count but not of the population it is divided by.
- An index, not a total. The kinds are counted in different units (victims, offenses, vehicles), so the grade adds their rates per 1,000 residents into an index and never shows a “total crimes” or a chance of being a victim.
- Hidden counts. SSMSI doesn’t publish a commune’s count when it’s small (five or fewer in at least one of the last three years). In its place it gives the average among the département’s communes whose count is hidden; the grade uses that average, never zero, and a town gets no Safety Grade when over a quarter of its index would come from such averages.
- Recorded, not all crime. Only offenses reported to or found by police and gendarmerie are counted. Reporting rates differ by kind: most vehicle thefts are reported, much family and sexual violence isn’t.
Questions about safety in Villepreux
Is Villepreux safe?
It has less crime per resident than 78% of compared French towns: an average of 5.5 recorded violent incidents and 10.3 recorded burglaries, vehicle thefts, thefts from vehicles and acts of criminal damage per 1,000 residents a year, 2023–2025. It grades A− for safety, #12 of 91 in Yvelines. Among the 664 French towns of 8,400 to 16,100 people, it is 43rd from the lowest rate.
Is crime going up in Villepreux?
The recorded rate in the graded categories rose 5% from 2023 to 2025: 16.4 per 1,000 residents in 2023, 17.3 in 2025. In a town this size a few dozen cases move the figure, so the grade uses the three-year average.
What is the most common recorded offense in Villepreux?
Criminal damage: 91 in 2025. Then fraud (67), theft without violence (41) and drug use (40).
Sources: SSMSI (Interior Ministry), recorded crime by commune, 2023–2025 (base communale de la délinquance enregistrée, 2026 edition) · INSEE, legal populations for each year · INSEE, census 2023 (jobs and working residents) · IGN Admin Express (boundaries) · TownRatings grades: our own summary of the data, ranking French towns against each other only, updated November 9, 2026. Under the Licence Ouverte / Open Licence 2.0 (Etalab).
Contains public sector information under the Licence Ouverte / Open Licence 2.0 (Etalab): INSEE, DGFiP, the Interior Ministry’s statistics service (SSMSI), the Ministry of Education (DEPP), the Health Ministry’s statistics service (DREES) and the Housing Ministry (Carte des loyers). Commune boundaries: IGN Admin Express.