
DEMap-doton-Millville, 2004
Millville’s story
140 years in pictures
The archive holds 1 old photo or paper going back to 2004.
- 1886Millville is settled
Each edition grades its towns against each other only.

A town of 2,145, settled in 1886.
The best of Millville’s subject grades are a B+ for health and a B for incomes. Millville’s median age is 65.1 years, above both the Delaware town median (40.4 years) and the median of U.S. towns (40.5 years). Only 1 of the 38 Delaware towns we compare have a higher share of households owning their home than Millville. 2% of the land in Millville is conserved, below the Delaware town median (15%) and near the median of U.S. towns (4.3%). Millville has 3 places on the National Register. Millville has fewer than 2,500 residents, so it gets subject grades but no overall grade.
Each subject compared with towns across the country (schools within Delaware), ordered by how far Millville is from typical.
How TownRatings grades towns →
The archive holds 1 old photo or paper going back to 2004.
Who provides power, water and the rest in Millville, and how to reach them.
EPA SDWIS (Oct 9, 2026) · HIFLD + EIA-861 2025 · Census 2020 ZCTAs · NCES 2024–25 · registration: vote.gov, updated Nov 18, 2024.
Ordered by what stands out in Millville.
People 65 and older are 51% of residents (21% statewide); children under 18 are 7% of residents (21% statewide). 44% of adults 25 and older hold a bachelor’s degree or more in Millville. Millville has grown 17% since 2020, to 2,145 residents in the Census Bureau’s 2025 estimate.
58% women, 42% men
About 72 men for every 100 women (the survey’s margin: ±4.7 points). Across Delaware, 51.6% of residents are women. Median age: women 65.4, men 64.2.
| Millville | DE | U.S. | |
|---|---|---|---|
| Under 10 | 4.9% | 11% | 11.6% |
| 10 to 17 | 1.7% | 9.7% | 10.3% |
| 18 to 24 | 2.5% | 8.5% | 9.1% |
| 25 to 34 | 5.1% | 12.6% | 13.7% |
| 35 to 44 | 3.9% | 12.2% | 13.2% |
| 45 to 54 | 10.7% | 11.4% | 12.2% |
| 55 to 64 | 20.5% | 14% | 12.7% |
| 65 to 74 | 39.4% | 12.5% | 10.2% |
| 75 and older | 11.4% | 8.1% | 7% |
| No diploma | 3.2% | 8.3% | 10.4% |
| High school | 22.4% | 28.8% | 26% |
| Some college | 19.8% | 18.8% | 19.1% |
| Associate’s | 11.1% | 8.3% | 8.8% |
| Bachelor’s | 24.6% | 20.4% | 21.6% |
| Graduate | 18.9% | 15.3% | 14.1% |
Census population estimates, 2025 · U.S. Census Bureau · ACS 2020-2024 5-year estimates · in a town of 2,100, single groups can be off by several points
Expected storm and flood damage is lower than in 71% of U.S. communities.
FEMA National Risk Index · OpenFEMA
28% of Millville adults sleep under 7 hours. Millville beats the Delaware average on 16 of 32 CDC measures and trails it on 7. 11% of Millville adults binge drink.
| Millville | Delaware towns | U.S. towns | |
|---|---|---|---|
| Frequent mental distress (CDC PLACES) | 12% | 16% | 17% |
| Sleep under 7 hours (CDC PLACES) | 28% | 37% | 36% |
| Feel lonely (CDC PLACES) | 26% | 33% | 33% |
| High blood pressure (CDC PLACES) | 47% | 37% | 35% |
| What stands out | Millville | DE |
|---|---|---|
| Fewer older adults who have lost all their teeth | 5.5% | 12.7% |
| Fewer adults facing housing insecurity | 5.4% | 11.6% |
| More adults who have had cancer | 14.9% | 9.1% |
CDC PLACES 2025 · modeled estimates for adults · CMS · HRSA
Millville has mild winters and warm summers. July afternoons reach 87°, January nights drop to 29° and about 11 inches of snow falls in a winter.
NOAA U.S. Climate Normals, 1991–2020
Most working residents leave Millville for work: only 4% work in town. Since 2013, Millville has added 385 jobs, to 784 in 2023. Millville’s average trip to work is 29 minutes.
| Millville | Delaware towns | U.S. towns | |
|---|---|---|---|
| Average trip to work | 29 minutes | 25 minutes | 25 minutes |
| Median household income | $100,000 | $81,000 | $80,000 |
| Below the poverty line | 5.8% | 8.2% | 9.6% |
| Working residents who work in town | 3.8% | 5.1% | 8% |
Census LEHD 2023 · ACS
| Biggest places to walk | Trails | Acres |
|---|---|---|
| 1. Evans Park | — | 5 |
Trails & parks © OpenStreetMap contributors · Conserved land: USGS PAD-US
Museums, parks, gardens and other places to visit around Millville. Close and well known come first.
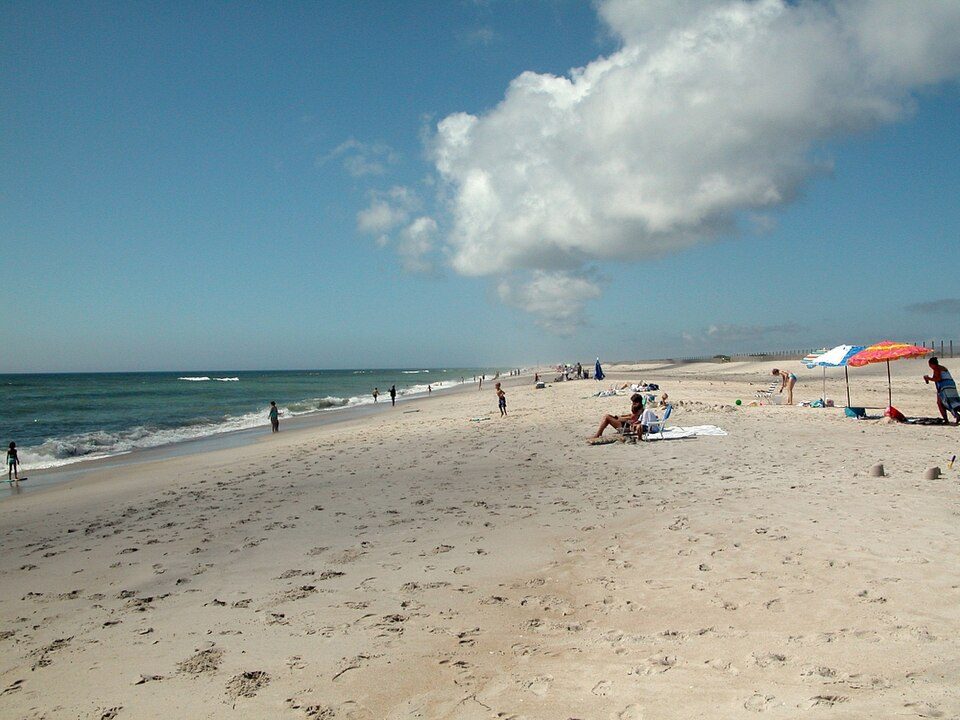 15 mi National SeashoreAssateague Island National Seashore2.3M visitors a year
 36 mi Theme parkMorey's Piers
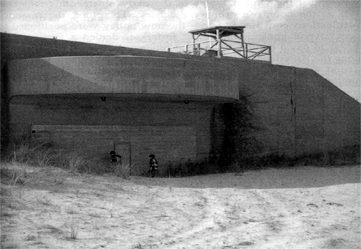 17 mi LandmarkFort Miles13 mi Theme parkJolly Roger Amusement Park
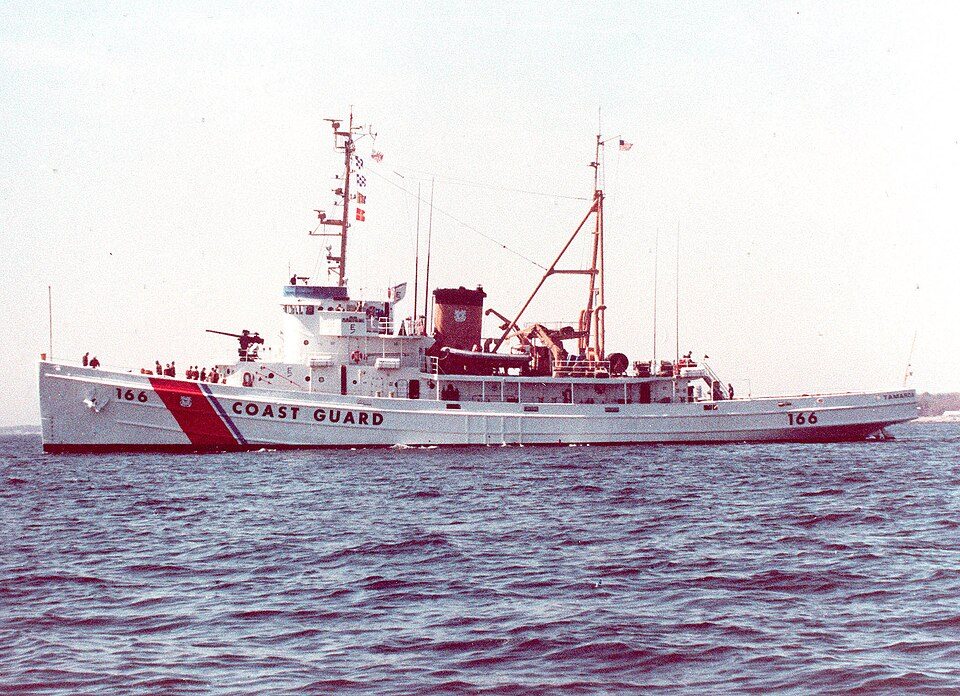 33 mi MuseumUSCGC Tamaroa
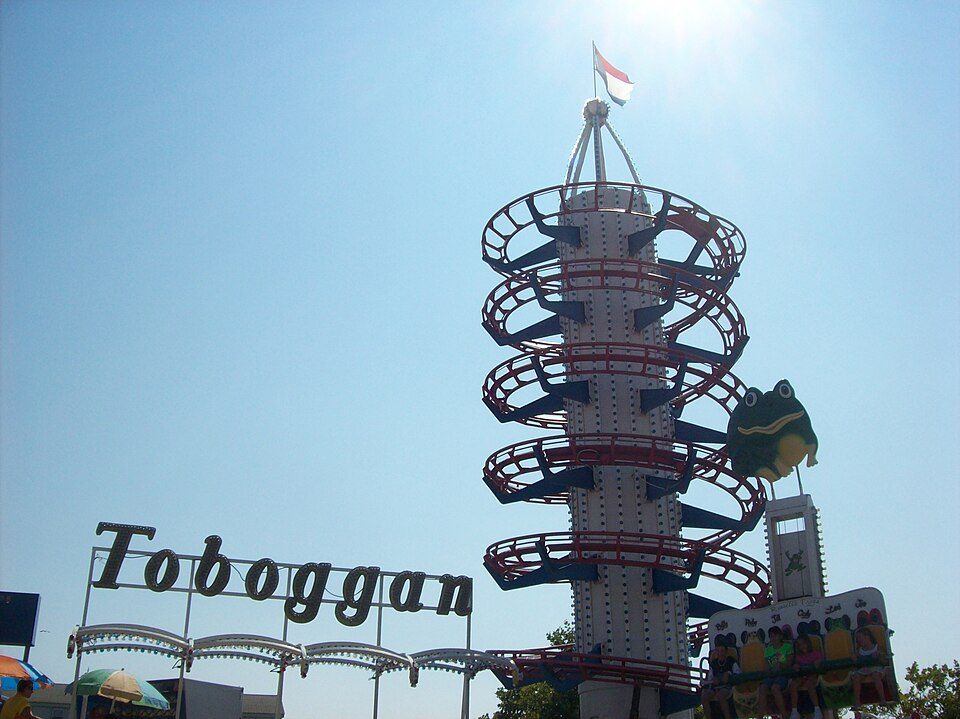 15 mi Theme parkTrimper's Rides
Assateague Island National Seashore: Fritz Geller-Grimm, CC BY-SA 2.5 · Morey's Piers: Smallbones, CC0 · Fort Miles: Unknown, Public domain · USCGC Tamaroa: Unknown USCG member, Public domain · Trimper's Rides: Mttbme, CC BY-SA 3.0
None within 15 miles of Millville; the nearest are
About 2 of every 100 Millville residents are enrolled in college, against 7 across Delaware.
Town in Delaware, United States
Millville is a town in Sussex County, Delaware, United States. The population in 2020 was 1,825, It is part of the Salisbury, Maryland-Delaware Metropolitan Statistical Area and lies within Baltimore Hundred.
From Wikipedia, licensed CC BY-SA 4.0 · facts via Wikidata (CC0)
One town shares a border with Millville.
| Town | DE rank | Overall | Cost | Safety | Schools | Health |
|---|---|---|---|---|---|---|
| Millville | — | — | C+ | — | B− | B+ |
| Ocean View | #18 | B− | C− | A− | B− | B+ |
Millville has fewer than 2,500 residents, so it gets subject grades but no overall grade. Millville reports no FBI crime data of its own. Compare Millville with a neighbor →
Short answers, built from the data on this page.
Cost of living, which also weighs rents, property taxes and how many households pay 30% or more of their income for housing, grades C+.


