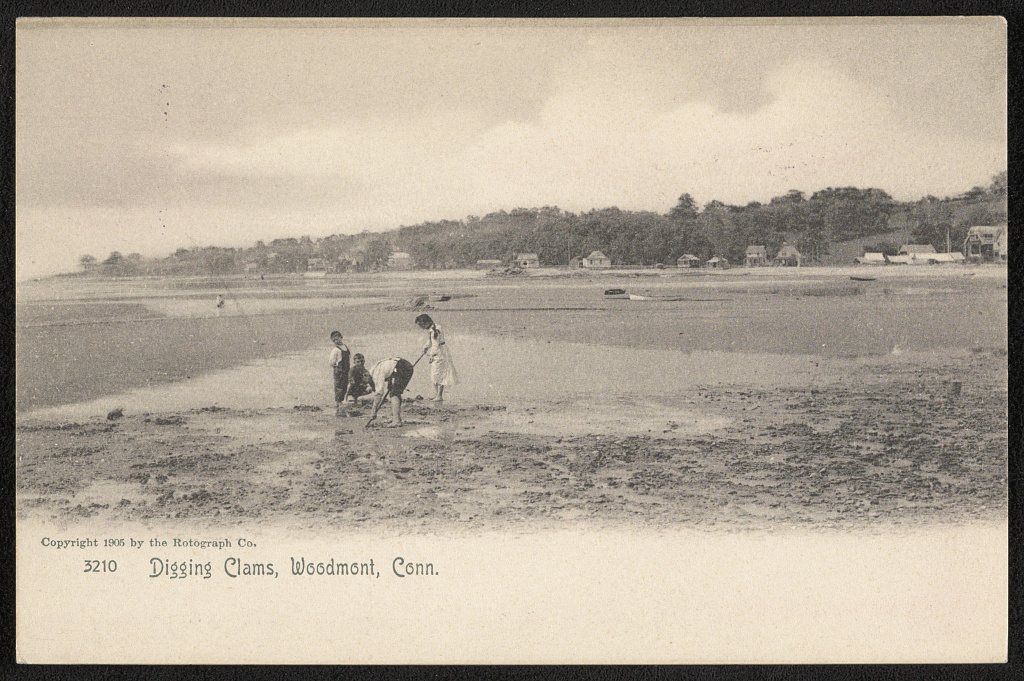
Digging clams, 1905
Woodmont’s story
152 years in pictures
Census counts: 194 in 1910, a peak of 2,114 in 1970, 1,486 in 2020. The archive holds 9 old photos and papers going back to 1905 and 3 maps from 1951 on.
- 1874Woodmont is settled
Each edition grades its towns against each other only.

A town of 2,391, settled in 1874.
The best of Woodmont’s subject grades are an A+ for incomes and an A for walkability and health; the weakest is a D− for cost of living. Woodmont’s concentration of trails is 0.1 miles per square mile, against 1.3 in Connecticut’s towns and 0.4 across U.S. towns. On history, just 4 of Connecticut’s 175 towns do worse. Woodmont has fewer than 2,500 residents, so it gets subject grades but no overall grade.
Where Woodmont beats most towns.
Coastal flooding makes up 12% of the storm damage FEMA expects here.
FEMA National Risk Index · OpenFEMA · OpenStreetMap
Each subject compared with towns across the country (schools within Connecticut), ordered by how far Woodmont is from typical.
How TownRatings grades towns →
Census counts: 194 in 1910, a peak of 2,114 in 1970, 1,486 in 2020. The archive holds 9 old photos and papers going back to 1905 and 3 maps from 1951 on.
Museums, parks, gardens and other places to visit around Woodmont. Close and well known come first.
 6 mi Stadium & arenaYale Bowl
 7 mi MuseumYale University Art Gallery
 29 mi Theme parkLake Compounce
 7 mi MuseumYale Center for British Art
 31 mi LakeCandlewood Lake
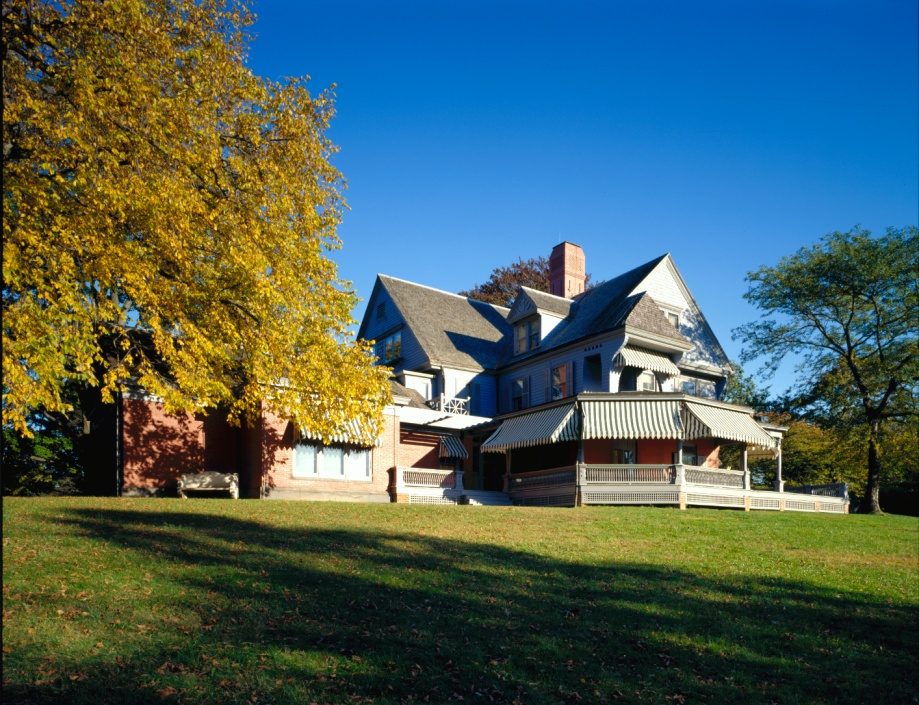 35 mi National Historic SiteSagamore Hill National Historic Site122K visitors a year
Yale Bowl: Kenneth Zirkel, CC BY-SA 4.0 · Yale University Art Gallery: Ragesoss, Public domain · Lake Compounce: Wildcat1 at English Wikipedia, Public domain · Yale Center for British Art: Sage Ross, Public domain · Candlewood Lake: Carol M. Highsmith, Public domain · Sagamore Hill National Historic Site: Unknown, Public domain
Who provides power, water and the rest in Woodmont, and how to reach them.
EPA SDWIS (Oct 9, 2026) · HIFLD + EIA-861 2025 · Census 2020 ZCTAs · NCES 2024–25 · registration: vote.gov, updated Sep 30, 2026.
Ordered by what stands out in Woodmont.
The share of adults in Woodmont who binge drink: 15%. On the CDC’s 32 measures, Woodmont is ahead of Connecticut on 12 and behind on 3. Among adults in the town, 8.5% smoke cigarettes, where Connecticut’s towns sit at 9.7% and U.S. towns at 14%.
| Woodmont | Connecticut towns | U.S. towns | |
|---|---|---|---|
| Frequent mental distress (CDC PLACES) | 14% | 15% | 17% |
| Smoke cigarettes (CDC PLACES) | 8.5% | 9.7% | 14% |
| Fair or poor health (CDC PLACES) | 12% | 14% | 19% |
| Frequent physical distress (CDC PLACES) | 11% | 12% | 14% |
| What stands out | Woodmont | CT |
|---|---|---|
| Fewer adults facing food insecurity | 7.2% | 14.9% |
| Fewer uninsured adults | 5.4% | 10% |
| More adults who have had cancer | 10.7% | 8.5% |
CDC PLACES 2025 · modeled estimates for adults · CMS · HRSA
For Woodmont, the median household income is $91,000. Employers in Woodmont shed 35 jobs between 2013 and 2023, to 56. Among 156 Connecticut towns, just 4 have a lower share of residents below the poverty line than Woodmont. Also worth knowing: nearly a fifth of workers work from home in the town.
| Woodmont | Connecticut towns | U.S. towns | |
|---|---|---|---|
| Working residents who work in town | 0.1% | 11% | 8% |
| Below the poverty line | 1.9% | 5.8% | 9.6% |
| Work from home | 19% | 16% | 11% |
| Average trip to work | 29 minutes | 27 minutes | 25 minutes |
Census LEHD 2023 · ACS
July afternoons reach 84°, January nights drop to 23° and about 34 inches of snow falls in a winter.
NOAA U.S. Climate Normals, 1991–2020
46% of Woodmont’s expected losses from natural hazards come from inland flooding, followed by hurricanes at 29%. Expected damage from storms and floods is lower here than in 65% of U.S. communities.
FEMA National Risk Index · OpenFEMA
No town among the 156 in Connecticut we compare has a lower share of conserved land than Woodmont. Parks and preserves locally: 3, covering 5 acres.
| Biggest places to walk | Trails | Acres |
|---|---|---|
| 1. Fannie Beach Community Center | — | 2 |
| 2. Trubee Doolittle Park | — | 2 |
| 3. Borough Hall Park | — | 1 |
Trails & parks © OpenStreetMap contributors · Conserved land: USGS PAD-US
The going rate for rent is $1,877 a month. 82% of Woodmont households live in a home they own.
| Woodmont | Connecticut towns | U.S. towns | |
|---|---|---|---|
| Median rent | $1,877 a month | $1,450 a month | $1,185 a month |
| Households that own their home | 82% | 81% | 73% |
Census ACS, 2020–24 · Zillow Home Value Index · Redfin Data Center
9 within 15 miles of the center of Woodmont
About 3 of every 100 Woodmont residents are enrolled in college, against 7 across Connecticut.
Where Woodmont’s working residents go each day. Line width shows the share.
Census LEHD 2023
Borough in Connecticut, United States
Woodmont is a borough of the City of Milford, in New Haven County, Connecticut. The population was 1,486 at the 2020 census. It was first created by Special Act of Connecticut General Assembly in 1893 as the Woodmont Improvement Association. In 1903 it became the Woodmont Association. It became a municipality in 1957 when the Connecticut General Assembly passed House Bill No. 2443 "An Act to change the Association status of Woodmont to Borough status". Woodmont is one of 9 Boroughs in Connecticut. The government of the borough works closely with the city of Milford to provide services such as road maintenance, snow plowing, street lighting, beach maintenance, and supplemental police service…
From Wikipedia, licensed CC BY-SA 4.0 · facts via Wikidata (CC0)
2 towns share a border with Woodmont.
| Town | CT rank | Overall | Cost | Safety | Schools | Health |
|---|---|---|---|---|---|---|
| Woodmont | — | — | D− | — | B− | A |
| Milford | — | — | C− | C+ | — | — |
| West Haven | #132 | C− | D− | B | C− | B− |
Woodmont has fewer than 2,500 residents, so it gets subject grades but no overall grade. Woodmont reports no FBI crime data of its own. Milford isn’t graded (fewer than 1,000 residents, or not enough data). Compare Woodmont with a neighbor →
Short answers, built from the data on this page.
Yes. The typical home is worth about $468,000, 5% above the Connecticut typical home. Cost of living, which also weighs rents, property taxes and how many households pay 30% or more of their income for housing, grades D−.


