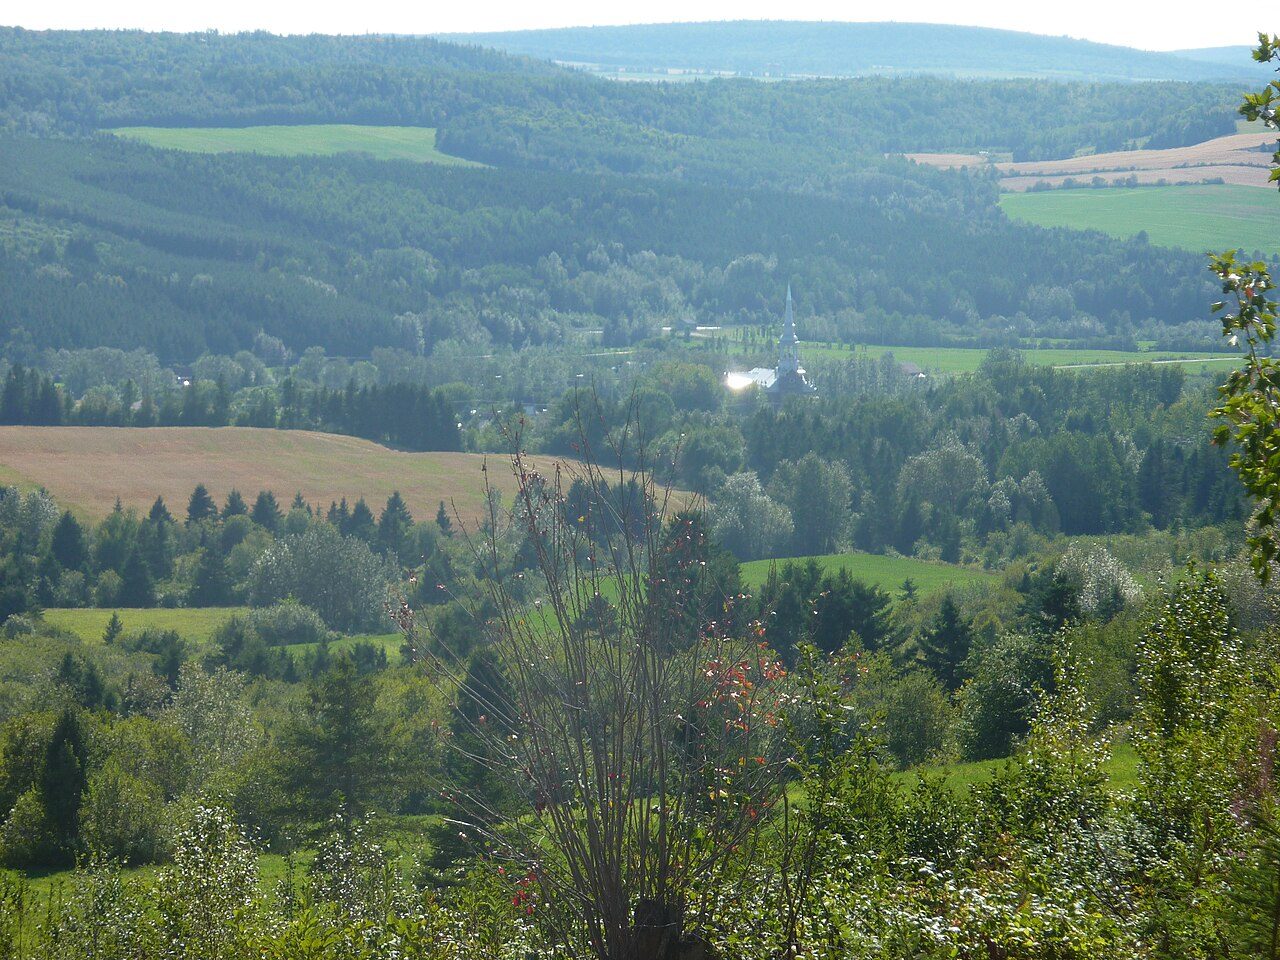
 Photo: Amqui · CC BY-SA 3.0
On hazards, Sainte-Angèle-de-Mérici comes out behind 86% of Canadian towns
No wildfire is mapped within 25 km of Sainte-Angèle-de-Mérici’s homes since 1986 (0% of the land, 0.000% a year). Seismic risk runs high: $0.077 of expected damage per $1,000 of buildings a year, the typical town $0.030. In Health Canada’s survey, 14% of homes tested in the area exceeded 200 Bq/m³ (6.6% typical). Hazard risk gives Sainte-Angèle-de-Mérici a grade of D, from earthquakes and radon alone.
What stands out about Sainte-Angèle-de-Mérici’s hazards
Four national sources, each read for Sainte-Angèle-de-Mérici: earthquakes, radon, past fires and flood studies.
What Sainte-Angèle-de-Mérici faces
Each hazard against its own yardstick; meters run from low to high on that yardstick.
Wildfire
Earthquakes
Radon
Flood study
Sainte-Angèle-de-Mérici grades D for hazard risk
Two inputs always count for Sainte-Angèle-de-Mérici, earthquakes and radon; the third, wildfire, counts only against a town.
How sure: The seismic figure is a long-run average from NRCan’s model, not a prediction. Small fires and grass fires are largely missing from the national burned-area record.
Wildfire is rare near Sainte-Angèle-de-Mérici: 0% of the land within 25 km burned since 1986, 0% within 5 km
Past fire around Sainte-Angèle-de-Mérici’s homes, from the national burned-area record, with the fuel within 5 km.
Fire claims 0.000% of the land around Sainte-Angèle-de-Mérici each year, a low band, with the typical Canadian town at 0.000%.
There is forest near Sainte-Angèle-de-Mérici’s homes (50% within 5 km) and more of it further out (59% within 25 km).
Shares of land within 5 and 25 km of populated blocks: burned at least once in 1986–2025 (CWFIS burned-area composite), forest fuel and grass (fire behaviour fuel types, 2026, 250 m grid).
Burn rate a year, towns in Quebec · highest of 514
Little or nothing burns around Sainte-Angèle-de-Mérici in a typical year; 145 of the 514 towns in Quebec share that, and Mistissini leads at 0.31%.
Each bar: the yearly average share of land within 25 km of a town’s homes that burned, 1986–2025 (CWFIS); the seven highest towns of 2,500 people or more.
Only 7.5% of Canada’s 2,610 towns are above the low band, which holds 92%; Sainte-Angèle-de-Mérici, at a rounded zero, is far from them.
Bands of the yearly burn rate: low under 0.05%, moderate under 0.25%, high under 1%, very high 1% or more; towns of 2,500 people or more.
Fire danger and active fires (CWFIS)
Canadian Wildland Fire Information System: National Burned Area Composite 1986–2025 and fire behaviour fuel types (2026), Natural Resources Canada. Measured within 25 km and 5 km of each populated dissemination area; past fire, not a forecast.
The flood map inventory lists nothing for Sainte-Angèle-de-Mérici
What Canada’s Flood Map Inventory lists for Sainte-Angèle-de-Mérici: who studied flooding and where to see their maps.
No flood study on the national inventory covers Sainte-Angèle-de-Mérici; ask the municipality, which is the authority for its flood maps.
Towns with a flood study on file
Flood maps are thinner in Quebec, 45% of towns against 58% nationally, and Sainte-Angèle-de-Mérici has none.
NRCan Canada Flood Map Inventory: a study footprint touching the town’s boundary; towns of 2,500 people or more.
The grade leaves flood out, since a study area says nothing about how many of Sainte-Angèle-de-Mérici’s homes are at risk.
The inventory’s own caution (NRCan): “The Canada Flood Map (CFM) does not include every flood hazard map in Canada and may be incomplete or contain inaccuracies. It should not be relied upon as the official source of flood mapping information. Furthermore, if a map appears to be missing, this does not necessarily mean that the area has never been mapped. For the official version of a map, updated information, or confirmation of applicable regulations, please contact the local authority responsible for flood mapping.”
Earthquakes cost buildings in Sainte-Angèle-de-Mérici $0.077 per $1,000 a year
Expected yearly building losses from earthquakes, from Natural Resources Canada’s model.
At $0.077 per $1,000, Sainte-Angèle-de-Mérici carries roughly 2.6 times the typical Canadian town’s earthquake risk ($0.030).
Shaking damage a year per $1,000 of building value
Below the middle in Quebec: Sainte-Angèle-de-Mérici’s $0.077 against a median of $0.14; La Pocatière has $0.48.
NRCan seismic risk model (2022): mean yearly building loss per $1,000 of value; medians of towns of 2,500 people or more.
More earthquake risk than most: only 28% of Canada’s 2,611 towns are above Sainte-Angèle-de-Mérici.
Each column: the share of Canada’s towns of 2,500 people or more in that range of yearly loss per $1,000 (NRCan, 2022).
Roads, pipes and bridges aren’t in Sainte-Angèle-de-Mérici’s figure, nor landslides or tsunami: it is buildings and shaking.
Natural Resources Canada, Canada’s Seismic Risk Model (2022), by census subdivision (2016 boundaries; a few 2021 subdivisions take their residents’ mean).
Test for radon in Sainte-Angèle-de-Mérici: 14% of area homes were over the guideline
Long-term radon tests in homes across the survey area, against Health Canada’s guideline.
Radon runs above the typical Canadian town (6.6%) in Sainte-Angèle-de-Mérici’s area, at 14%. Sainte-Angèle-de-Mérici doesn’t get its own radon tests figures; the ones here come from the Bas-Saint-Laurent health region.
Tested homes over 200 Bq/m³
Over 600 Bq/m³
Around Sainte-Angèle-de-Mérici, 14% of tests were over 200 Bq/m³ and 1.8% over 600, against a median of 8.2% in Quebec.
Health Canada radon survey (2009–2011), by 2007 health region; medians of towns of 2,500 people or more.
The 10–20% band holds 22% of Canada’s 2,611 towns, Sainte-Angèle-de-Mérici among them; 4.6% rank above.
Each bar: the share of Canada’s towns of 2,500 people or more whose survey area had that share of tests over 200 Bq/m³.
The share describes the area, not a house: in Sainte-Angèle-de-Mérici as anywhere, test to be sure.
Health Canada, Cross-Canada Survey of Radon Concentrations in Homes (2009–2011).
Weather and fire alerts for Sainte-Angèle-de-Mérici
Environment and Climate Change Canada issues the weather alerts for Sainte-Angèle-de-Mérici; Alert Ready carries the urgent ones to phones, radio and TV.
| Alert | What it means |
|---|---|
| Warning | Severe weather is happening or about to: act now. |
| Watch | Conditions favour severe weather: be ready. |
| Advisory | Weather that is less severe but could disrupt the day. |
| Special weather statement | Unusual weather worth knowing about. |
| Special air quality statement | Poor air, often wildfire smoke. |
In fire season, check CWFIS for danger and active fires around Sainte-Angèle-de-Mérici, and listen to local authorities for orders.
Weather alerts (ECCC) · Alert Ready · Fire danger and active fires (CWFIS)
Hazards in the places around Sainte-Angèle-de-Mérici
Wildfire band, earthquake risk, radon and flood studies for each place nearby.
| Town | Wildfire | Quake $/1,000 | Radon | Flood study |
|---|---|---|---|---|
| Sainte-Angèle-de-Mérici | Low | $0.077 | 14% | None listed |
| Price 1,701 · 9.8 km | Low | $0.11 | 14% | None listed |
| Mont-Joli 6,492 · 12 km | Low | $0.093 | 14% | None listed |
| Saint-Gabriel-de-Rimouski 1,239 · 14 km | Low | $0.085 | 14% | None listed |
Sainte-Angèle-de-Mérici’s low band tops its neighbours; Price is next (low).
Radon is the survey area’s figure, so neighbours in one area share it.
Get ready for what Sainte-Angèle-de-Mérici faces
What to do about the hazards Sainte-Angèle-de-Mérici faces, and what to ask before you buy.
- Test for three months in winter.
- Over 200 Bq/m³: fix it.
- Kits are cheap; pros test too.
- Never drive through floodwater.
- Move papers and medicines upstairs.
- Ask whether your street is mapped.
- Clear needles and wood nearby.
- Keep a grab-and-go bag ready.
- In smoke, stay in; filter air.
- Has it had a radon test?
- Ask the municipality for flood maps.
- Are flood and wildfire insured?
What this data can and can’t tell you
- Flood studies aren’t flood zones. Flood studies cover areas of every size, which is why the page lists them for Sainte-Angèle-de-Mérici without grading them.
- Earthquakes are modelled. Shaking damage is modelled from the ground, the buildings and the odds of each quake, and published for whole subdivisions such as Sainte-Angèle-de-Mérici’s.
- Radon is a survey. Radon figures pool the survey’s home tests by area: postal areas once their boundaries arrive, the 2007 health region around Sainte-Angèle-de-Mérici until then.
- Wildfire counts one way. The wildfire figure is the share of land within 25 km of Sainte-Angèle-de-Mérici’s homes burned each year from 1986 to 2025, past fire rather than a forecast, and it can only lower Risk.
Questions about flooding and hazards in Sainte-Angèle-de-Mérici
Does Sainte-Angèle-de-Mérici flood?
Nothing is listed for Sainte-Angèle-de-Mérici on the national inventory (0); local maps may still exist with the municipality.
How big is the earthquake risk in Sainte-Angèle-de-Mérici?
In NRCan’s seismic model, Sainte-Angèle-de-Mérici’s buildings lose $0.077 per $1,000 of value in an average year.
How is Sainte-Angèle-de-Mérici’s Hazard risk Grade worked out?
Sainte-Angèle-de-Mérici grades D for hazard risk, from earthquakes and radon, with wildfire counted only where it lowers the grade.
Is radon a problem in Sainte-Angèle-de-Mérici?
In Health Canada’s survey, 14% of 171 homes tested in Sainte-Angèle-de-Mérici’s area were above 200 Bq/m³, though only a test tells you about one house.
Is Sainte-Angèle-de-Mérici at risk of wildfire?
The burned-area record shows next to nothing around Sainte-Angèle-de-Mérici (0% within 25 km since 1986), so its band is low.
Seismic risk: Natural Resources Canada. Radon: Health Canada. Wildfire: Canadian Wildland Fire Information System. Flood studies: Natural Resources Canada, Canada Flood Map Inventory. Contains information licensed under the Open Government Licence – Canada.
Sources: NRCan, Canada’s Seismic Risk Model 2022 · Health Canada, Cross-Canada Survey of Radon Concentrations in Homes · CWFIS, National Burned Area Composite and FBP fuel types · NRCan, Canada Flood Map Inventory. Under the Statistics Canada Open Licence.
Adapted from Statistics Canada (Census of Population 2021, population estimates 2025, 2021 census boundaries) under the Statistics Canada Open Licence; this does not constitute an endorsement by Statistics Canada. Neighbourhood names in some cities © OpenStreetMap contributors (ODbL).