
Saint-SauveurQuebec
12,112 people live in this town in Quebec. Its census division is Les Pays-d'en-Haut.
Is Saint-Sauveur a good place to live?
Real strengths, and real weak spots. With a C+ overall, Saint-Sauveur sits #393 of 499 in Quebec. On that grade it does better than 37% of Canadian towns. The weak point is cost of living (D). Its strongest subject is health (A). The rest of its grades are middling: B for safety and B for walkability.
This town's rent is the 2021 census rent scaled to 2025 by its province's ratio of surveyed to census rents: no rental survey covers it, so its Cost Grade is less sure. Safety is the Sûreté du Québec unit's figure for the whole MRC. Crime here is counted against the people who live here, but many visitors or second-home owners add to it, so the rate per resident runs higher than residents' own risk. No School Grade: this province doesn't publish comparable results school by school. Health is graded on the health region's survey figures and life expectancy, with the distance to hospital giving the town its own spread.
How Saint-Sauveur grades
Each subject compares Saint-Sauveur with Canadian towns of 2,500 or more, ordered by how far it is from the middle. Towns in other countries are graded separately.
How TownRatings grades Canadian towns →
What makes Saint-Sauveur stand out
The 3 things Saint-Sauveur does most differently from other towns.
The data
Data highlights are ordered by what stands out in Saint-Sauveur.
Rent takes more of local pay in Saint-Sauveur than in Quebec’s towns or Canadian towns: 25% of household income
70% of households own their home.
What homes were worth · The median owner’s estimate at the 2021 census
| Census 2021 | Saint-Sauveur | Quebec | Canada |
|---|---|---|---|
| Rent as a share of income | 25% | 18% | 20% |
| Households spending 30%+ on shelter | 23% | 13% | 18% |
Statistics Canada, Census 2021; CMHC Rental Market Survey via Statistics Canada · Home values are owners’ own estimates at the May 2021 census, and incomes are for 2020.
Saint-Sauveur scores better for health than 89% of Canadian towns
Shared with the rest of the Région des Laurentides: health survey and life expectancy
The survey finds 60% of adults in very good or excellent health, above Quebec’s towns (56%) and Canadian towns (52%) alike. For 2022/2024, the region’s figure is 82.2 years at birth, 83.7 for women and 80.8 for men.
Very good or excellent health · adults, age-standardised
| Health | Saint-Sauveur | Quebec | Canada |
|---|---|---|---|
| Very good or excellent health | 60% | 56% | 52% |
| Chronic conditions (average share) | 13% | 15% | 17% |
| Smokers | 11% | 12% | 12% |
| Life expectancy at birth | 82.2 | 82.5 | 81.5 |
Statistics Canada, Canadian Community Health Survey 2023/2024 and life expectancy 2022/2024; Open Database of Healthcare Facilities
Commuters in Saint-Sauveur travel further than in Quebec’s towns or Canadian towns, 30 min on average
92% of commuters drove, close to both Quebec’s towns (90%) and Canadian towns (89%).
How working residents got to work · census 2021
| Census 2021 | Saint-Sauveur | Quebec | Canada |
|---|---|---|---|
| Average trip | 30 min | 27 min | 26 min |
| Car or van | 92% | 90% | 89% |
Statistics Canada, Census 2021 (labour and commuting) · Census day was in May 2021, mid-pandemic, so commuting and work figures carry the lockdowns’ mark.
Saint-Sauveur’s hazards at a glance: a low wildfire record and 10% of area homes over the radon guideline
The radon tests numbers here cover the Laurentides health region
The expected yearly loss to earthquakes is $0.094 for each $1,000 of buildings, below Quebec’s towns ($0.14) but above Canadian towns ($0.030). Wildfire is rare near Saint-Sauveur: 0.1% of the land within 25 km has burned since 1986, a burn rate of 0.002% a year. No flood study for Saint-Sauveur is on the national inventory.
Radon tests above the guideline · share of tested homes, 200 Bq/m³
| Hazards | Saint-Sauveur | Quebec | Canada |
|---|---|---|---|
| Radon tests above the guideline | 10% | 8.2% | 6.6% |
| Earthquake loss per $1,000 of buildings a year | $0.094 | $0.14 | $0.030 |
NRCan seismic risk model and burned areas, Health Canada radon survey, the Flood Hazard Map Inventory
More people in Saint-Sauveur speak English and French than in Quebec’s towns or Canadian towns: 64%
1.9% of residents belong to a visible minority, lower than both Quebec’s towns (3.5%) and Canadian towns (15%). Immigrants make up 7.2% of residents, above both Quebec’s towns (2.6%) and Canadian towns (6.4%).
Ages · Share of residents in each age group, Census 2021
Schooling · Highest qualification, residents 15 and over
Women and men · all residents
52.3% of Saint-Sauveur’s residents are women
Women numbered 6,055 and men 5,525 in 2021, next to a 50.9% share of women for Canada.
| Saint-Sauveur | Quebec | Canada | |
|---|---|---|---|
| Under 15 | 9.9% | 17% | 16% |
| 15 to 64 | 55% | 62% | 64% |
| 65+ | 35% | 20% | 19% |
| No certificate, diploma or degree | 13% | 19% | 16% |
| Postsecondary qualification | 63% | 59% | 56% |
Statistics Canada, Census 2021; Quebec and Canada: medians of towns of 2,500+
Saint-Sauveur’s grade for safety: a B
Source area for Crime Severity Index, Violent Crime Severity Index, violent crime and property crime per 1,000: Pays-d'en-Haut MRC
The index for the force that serves it came to 53, about level with Quebec’s towns (56) and below Canadian towns (67). For every 1,000 residents of its police area, 16.9 property crimes are reported each year.
Year by year · Crime Severity Index for each year
| 2023–2025 | Saint-Sauveur | Quebec | Canada |
|---|---|---|---|
| Property crime per 1,000 | 16.9 | 16.6 | 31.2 |
| Violent Crime Severity Index | 72 | 88 | 86 |
| Crime Severity Index | 53 | 56 | 67 |
Statistics Canada, Uniform Crime Reporting Survey, 2023–2025 average
Precipitation in Saint-Sauveur tops that of 88% of Canadian towns: 1,178 mm a year
Snow peaks in January: 56 cm in a normal year. The most precipitation falls in October: 120 mm in a normal year. Some 218 cm of snow falls in a typical year, near Quebec’s towns (217 cm) and higher than Canadian towns (141 cm). Gardeners get 143 frost-free days, from 12 May to 3 October.
Average high by season · ECCC normals, 1991–2020
| Normals, 1991–2020 | Saint-Sauveur | Quebec | Canada |
|---|---|---|---|
| Precipitation a year | 1,178 mm | 1,041 mm | 883 mm |
| Snowfall a year | 218 cm | 217 cm | 141 cm |
| July afternoon high | 26.5°C | 26.5°C | 25.5°C |
Environment and Climate Change Canada, Canadian Climate Normals 1991–2020 (Lachute)
Saint-Sauveur in November: highs near 5°C, lows near −2°C
ECCC’s forecast for Saint-Jérôme is on the Weather page, hour by hour. The month after, December, normally sees −2°C afternoons and −10°C nights. Snowfall in a normal November: 17 cm. Expect about 93 mm of rain and snow over November.
Normal highs, the months ahead · ECCC normals, 1991–2020
| Season | High | Low | Rain and snow |
|---|---|---|---|
| Winter | −4°C | −13°C | 262 mm |
| Spring | 11°C | 0°C | 262 mm |
| Summer | 25°C | 14°C | 327 mm |
| Autumn | 13°C | 4°C | 327 mm |
ECCC normals, 1991–2020 (Lachute); the forecast is on the Weather page
One councillor per 1,730 residents: Saint-Sauveur is more thinly represented than 85% of Quebec municipalities
Saint-Sauveur’s council has 6 councillors and is led by Luc Martel, the mayor.
Wikidata, MAMH, MMAH, Statistics Canada
Fewer visits per person served than 83% of Quebec’s town libraries: Saint-Sauveur public library counts 1.5
Saint-Sauveur public library serves 12,130 people.
Provincial library statistics, OpenStreetMap, the CRA and Statistics Canada
5 schools serve Saint-Sauveur, 4 elementary schools and 1 secondary school
One of the 5 teaches in English, against 10% of schools in Quebec. Measured from the centre, the closest high school lies 6.5 km off, higher than both Quebec’s towns (1.2 km) and Canadian towns (1.2 km).
| School | Level | Students | System |
|---|---|---|---|
| École de l'ExpéditionIn Saint-SauveurElementary | Elementary | – | French public |
| École secondaire Augustin-Norbert-MorinNearest secondary school, 3 kmSecondary | Secondary | – | French public |
| École primaire de Morin-Heights EnglishTeaches in EnglishElementary | Elementary | – | English public |
Schools by system · Schools within 3 km
| Schools within 3 km | Saint-Sauveur | Quebec | Canada |
|---|---|---|---|
| Nearest secondary school | 6.5 km | 1.2 km | 1.2 km |
| School boards | 2 | 2 | 3 |
Provincial school lists and results, 2025-26 · Why no schools grade in Quebec? The ministry publishes its success rates by school service centre, not school by school.
7 beaches lie within 5 km of Saint-Sauveur
Count 21 protected areas within 10 km of town. Within 100 km there is no national park. 34 km from town is Voyageur Provincial Park, the nearest provincial park. 06151R003 Biological Refuge (81 ha) is the biggest, 5.4 km from town.
Protected land · of the land within 10 km
| Outdoors | Saint-Sauveur | Quebec | Canada |
|---|---|---|---|
| Public protected areas within 10 km | 2 | 10 | 4 |
| Protected land within 10 km | 2.3% | 4.9% | 2.3% |
Canadian Protected and Conserved Areas Database (CPCAD), OpenStreetMap routes and beaches
Saint-Sauveur: 1 historic place on Canada’s heritage registers
9.2% of its homes were built before 1961, below both Quebec’s towns (21%) and Canadian towns (18%).
Historic places by designation · inside the town
| Heritage | Saint-Sauveur | Quebec | Canada |
|---|---|---|---|
| Homes built before 1961 | 9.2% | 21% | 18% |
Canadian Register of Historic Places, Directory of Federal Heritage Designations, Québec’s Répertoire du patrimoine culturel, Wikidata; Census 2021 homes by period
Everything we know about Saint-Sauveur
Laurentian Ski Museum and 9 more in and around Saint-Sauveur
Sights in Saint-Sauveur and close by, ordered by how widely each is known.
 MuseumLaurentian Ski Museumin town
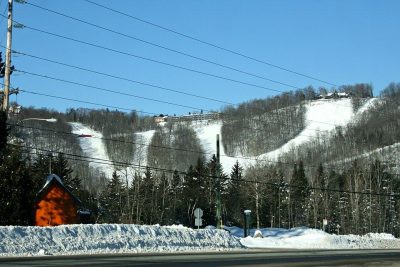 Ski hillSki Mont Gabriel400 m outside town, to the northSki hillSki hillMont Habitantin townSki hillSki hillSommet Saint-Sauveurin townSki hillSki hillSki Morin Heights3.7 km outside town, to the westSki hillSki hillSki Chantecler4.1 km outside town, to the north
Photos: each place’s Wikidata image, from Wikimedia Commons under the licence below (our copy, resized).
Photo credits (2)
- Laurentian Ski Museum: MissNotaBenepics, CC BY-SA 4.0, Wikimedia Commons
- Ski Mont Gabriel: P199, CC BY-SA 4.0, Wikimedia Commons
Famous people from around Saint-Sauveur
One notable person was born in Saint-Sauveur; with them, the best known born in the towns around it.



Photo credits
Maghalie Rochette: Ralph Arvesen, CC BY 2.0 · Claude-Henri Grignon: Photo : George Nakash, Bibliothèque et Archives Canada, 1971-114 NPC, Public domain · France D'Amour: Pierre5018, CC BY 4.0 · François Leroux: Michael Miller, CC BY-SA 3.0
About Saint-Sauveur
Town in Quebec
Statistics Canada treats Saint-Sauveur as a single census subdivision in Quebec, and TownRatings keeps to that line.
Statistics Canada: population estimates 2025 (17-10-0155), Census of Population 2021, 2021 census boundaries.
- Population
- 12,112 (people, 2025 estimate)
- Province or territory
- Quebec
- Census division
- Les Pays-d'en-Haut
- Census subdivision
- 2477043
Saint-Sauveur’s neighbours
The nearest places of 1,000 or more. Statistics Canada
| Town | People | km | Overall | Cost | Safety | Health |
|---|---|---|---|---|---|---|
| Saint-Sauveur | 12,112 | — | C+ | D | B | A |
| Piedmont | 3,667 | 3.6 | C+ | D | B | A |
| Morin-Heights | 5,086 | 4 | B | C+ | B | A |
| Sainte-Anne-des-Lacs | 4,080 | 6.3 | B+ | B− | B | A |
| Sainte-Adèle | 15,216 | 7.8 | B− | C | B | A |
| Mille-Isles | 1,886 | 7.9 | — | C− | C+ | A |
| Prévost | 14,275 | 10 | A | B− | A | A |
People: Statistics Canada, Census 2021. Distances: centre to centre.
Questions about Saint-Sauveur
Do people in Saint-Sauveur speak French?
Yes: this is Quebec. 34.2% of residents speak only French and 64% speak both French and English (Canadian towns’ median: 8%).
Is Saint-Sauveur growing?
It added people: 10,231 in 2016, 11,580 in 2021, 13.2% more, where the middle of Canadian towns grew 4.1%. Statistics Canada’s 2025 estimate is 12,112.
Who are the people of Saint-Sauveur?
Visible minorities are 2% of the population, where the middle of Canadian towns is 15%. Immigrants make up 7%, and Indigenous people 1%.
Is Saint-Sauveur a young town or an old one?
At 58.4, its median age compares with 45.2 across Canadian towns. Children make up 10% of the population and seniors 35%.
Sources: Statistics Canada, Census of Population 2021 · population estimates 2025 (17-10-0155) and 2021 census boundaries · Uniform Crime Reporting Survey 2023–25 (35-10-0026, 35-10-0183 to 35-10-0190) · CMHC rents as published by Statistics Canada (34-10-0133) · grades by TownRatings. Under the Statistics Canada Open Licence.
Adapted from Statistics Canada (Census of Population 2021, population estimates 2025, 2021 census boundaries) under the Statistics Canada Open Licence; this does not constitute an endorsement by Statistics Canada. Neighbourhood names in some cities © OpenStreetMap contributors (ODbL).